We all want high performing applications and when you are in the cloud that is no different, if anything it is even more important. With this post I will discuss some areas where I have been “stung” by so you can learn from my mistakes when using Azure SQL Database. Then I will dedicate a section on what tools you can use to help with your performance tuning exercises.
Sizing is key
Azure SQL Database comes in various tiers, you need to pick the right one.

Here is the list with its targeted workload.
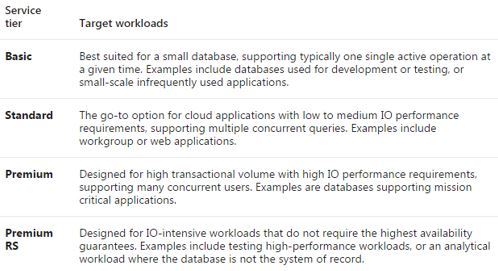
Selecting the right service tier is so important, I have found mistakes where people just don’t really understand what their requirement is, i.e. they don’t know what service tier will suit their needs. From this people tend to select the wrong one and in an attempt to save money they would go with a “lower” tier.
Personally I know what tier is suitable for me but then the question is what level within the tier do you really need? For Standard we have these options shown below, again from my experience people tend to go lower to save money.
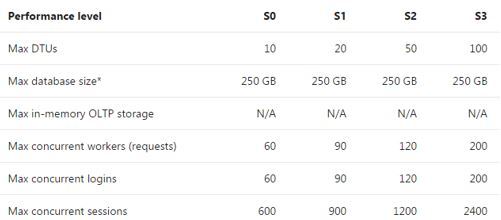
Let’s assume that you are not driven by logins, workers and session counts how does one select the right level? What exactly does DTUs (Database Transaction Units) mean? I suggest reading this post by Andy Mallon https://sqlperformance.com/2017/03/azure/what-the-heck-is-a-dtu
I am going to undersize my database and create a S0 database and run some day to day tasks – let’s see what happens. I will open up connections and issue some queries via my application. I would not class these queries as bad, what I am trying to drive here is getting the sizing right for your workload.
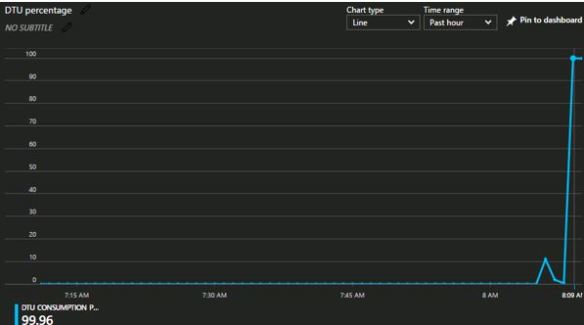
Over 99% of DTU utilisation! If I move to S3 then utilisation is nowhere near 99%.
If you keep moving up tiers and you notice DTUs still get consumed, well this moves onto my next point where I have seen problems arise, you could say, the root cause of undesired DTU consumption.
It’s the code
Optimal queries are ever so important in the Azure world; we need to make sure that we are doing the basics of correct query writing.
If I am faced with an issue I rarely play around with the tiers and performance levels, I go hunting for bad queries, then if that does NOT fix the issue then I may consider upgrading, assuming you have the budget for it.
Trivialised queries now on show just to send the message home.
SELECT * FROM [dbo].[Audi]
WHERE UserId = 2

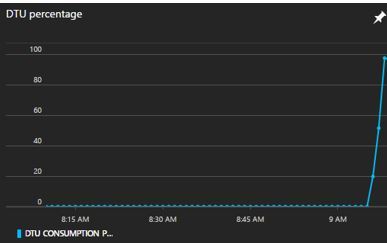
3 minutes to complete with this effect on DTU.
Indexing is KING
I feel I can really sort this out. I remove the * and I go after the predicate, I know this query is an important data access pattern for the app so I will cover it.
CREATE NONCLUSTERED INDEX [IDX_NCI_AppCars]
ON [dbo].[Audi] ([UserId])
INCLUDE ([Date],[TransactionId],[Code])
Execution time sub 1 second.
 SELECT
[Id],
[Date],
[Code],
[TransactionId]
FROM [dbo].[Audi]
WHERE UserId = 2

<1% DTU consumption – that’s the way I like it (Below red circle).

Can you see the impact that fundamentals have here? If not, see the next short section.
The ultimate “Bad” combo
So the worst situation you can find yourself in is if you have a wrong tier of SQL Database AND poor running code.
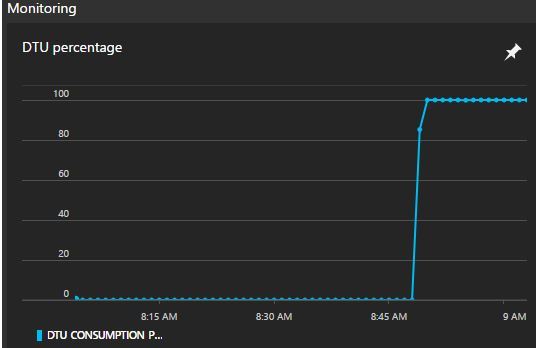
Azure will then warn you, something that I used to see a lot in my earlier days.

If you hit your DTU limits you will notice an increase in latency and you may even see incoming request rejection, something you definitely do not want.
Database Elastic Pools – know your patterns
You can get in a right mess with elastic pools if you do not understand your databases. Assume my environment is as follows: 2 S2 and 9 S0 databases I then decide to use a Standard 100 eDTU (elastic Database Transaction Units) elastic pool.
Rather than provide a dedicated set of resources (DTUs) to a SQL Database that is always available regardless of whether needed not, you can place databases into an elastic pool on a SQL Database server that shares a pool of resources among those databases. The shared resources in an elastic pool measured by eDTUs.
The key to using elastic database pools is that you must understand the characteristics of the databases involved and their utilisation patterns, if you do not understand this then the idea of using an elastic pool will cause performance problems.
For example, if the maximum amount my pool has is 100 eDTUs, I know for a fact that both S2 databases will not be used at the same time, the other S0 databases might be used at the same time, at the most 3 of them at the same time. Basically what I am saying here is that I know that when the databases concurrently peak I know that it will not go beyond the 100 eDTU limit. Let’s look at it this way, if both my S2 databases and 3 S0 databases peak at the same time, then I will go well beyond my limit – but I know this won’t happen, if it did, I will know about it via disgruntled customers.
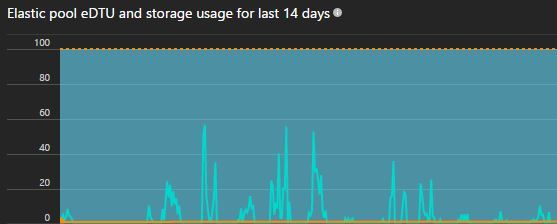
As you can see from my pool, I am well within my limits, that is after some painful introductions to the world of elastic pools.
Know your tools
One of the challenges I faced when going through a tuning exercise was what tools could I use?
So here is a list of what I personally use, get used to them, get intimate with them, they will be skills that one day you might need to call on.
Extended Events
How you create these sessions ARE DIFFERENT to something like your local SQL Server 2016. I reference this post: https://blobeater.blog/2017/02/06/using-extended-events-in-azure/
Quick snippet:
CREATE EVENT SESSION azure_monitor
ON DATABASE

.

.

ALTER EVENT SESSION azure_monitor
ON DATABASE
STATE = START;
Azure Portal
More specially the Query Performance Insight tool. I use this to work back to the TSQL that you should start tuning.
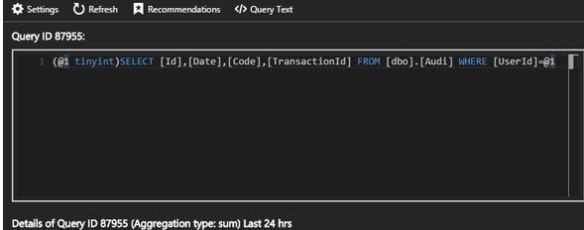
As an example I will target that yellow bar below.

Click it to drill into the actual code.
Automatic Tuning?
Notice the Recommendations option above? This is where you can set automatic tuning. This service monitors the queries that are executed on the database and can automatically improve performance of the workload. Azure SQL Database has a built-in intelligence mechanism that can automatically tune and improve performance of your queries by dynamically adapting the database to your workload.
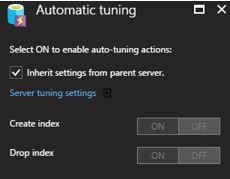
I personally don’t use it, but I can understand why some will. It is clever, I have seen the tool implement some indexes but then “revert” them where it decided that it really didn’t bring significant improvements. Maybe one day they will be able to do index consolidation tasks? Who knows.
As a side note Automatic plan correction is coming in SQL Server 2017.
Query Store
One of the best features within the whole product suite. It is your friend, learn how to use, get intimate with you and enjoy it. You access this via SQL Server Management Studio (SSMS). I would like to see this integrated into the portal one day. But for the time being you will need to use SSMS.
It is just like the “earth” based SQL Server, the only difference I am aware of is QUERY_CAPTURE_MODE setting where it can be set to ALL (capture all queries), AUTO (ignore infrequent and queries with insignificant compile and execution duration) or NONE (stop capturing new queries). The default value on SQL Server 2016 is ALL, while on Azure SQL Database is AUTO.
Also another key point is that Microsoft is in the process of activating Query Store for all Azure SQL databases (existing and new).
Conclusions
Hopefully after reading this post you will see how important is it to do the basics, such as getting your capacity requirements right and doing the basics of query writing and indexing. I then finished this post with a list of tools to help you with your performance tuning exercises.
Sources
https://docs.microsoft.com/en-us/azure/sql-database/sql-database-service-tiers
https://docs.microsoft.com/en-us/azure/sql-database/sql-database-automatic-tuning
Filed under: Azure, Cloud Blog Series Tagged: Azure, Cloud Busting, SQL database, Technology
![]()


