A couple of weeks ago I posted about how different execution plans look when using the Azure Management Portal. I promised to look at a more complex plan and here we are. The query looks like this:
SELECT*
FROMdbo.Agent AS a
JOIN dbo.Resource AS r
ON a.AgentId = r.AgentId
JOIN dbo.MovieStageResource AS msr
ON r.ResourceId = msr.ResourceId
JOIN dbo.MovieStage AS ms
ON msr.Movieid = ms.MovieID
   AND msr.MovieStageDefinitionId = ms.MovieStageDefinitionId
JOIN dbo.Movie AS m
ON ms.MovieID = m.MovieId
WHEREa.AgentId = 42;
I didn’t go nuts in creating a crazy complex query. I just wanted to see a standard set of different operators to see how things changed. As before, I’m working off a controlled database that has identical structures and data in both the Azure database and my local copy of SQL Server. This way, the likelihood of identical plans is increased. Plus, if there are differences, it’s coming down to the differences in compilers between the two platforms, which makes things more interesting.
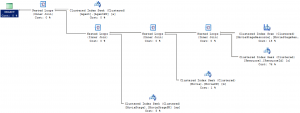
Running the query on my local server, the execution plan looks like this:
If you click on it to blow it up, you’ll see a pretty standard plan. If we read it in logical fashion (left-to-right, making Rob proud) you’ll see that a nested loop joins data between the Agent table and another nested loop. That loop joins between yet another nested loop and the MovieStage table. That loop is between one more nested loop and the Movie table. The final loop is between the MovieStageResource table and the Resource table. Nothing shocking or weird.
Same query, different (?) execution plan from Azure
First thing that jumps out at you are the red operators. We’ll get to those in a minute. So the plan looks totally different, right? No, not really. It’s pretty much the same. The estimated operation costs are different, which is interesting, but the basic plan is the same.
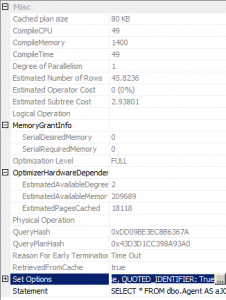
First thing to check in every execution plan? The properties in the first operator. Here they are from SQL Server:
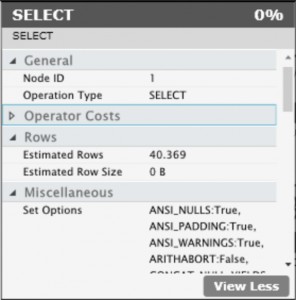
Zoom in to read this if you need to. It’s a Full optmization, but the reason for early termination is a TimeOut. This means we can’t really trust this plan. On another day you may even see the plan change with the same query. Certainly if a service pack came out or something else the plan could change. However, this query looks like it’s properly optimized, even though the optimizer says it isn’t. Let’s see the properties from Azure. I’ve zoomed in to the “More” properties to get at some details:
The first point to note is the Estimated Rows value. Here, in Azure, it is 40.369. Meanwhile, back in SQL Server it is 40.8236. Now these differences are pretty subtle. I sure wouldn’t be sweating out of data statistics because of a .4546 discrepancy, but it gives us a clear indication why the estimated values for identical operations against identical data and structures are different. I’ll also note that the Optimization Level on the Azure query was also Full and the Reason for Early Termination was a timeout. These are fun and interesting results.
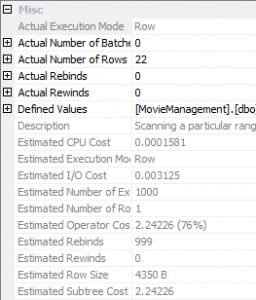
Now, let’s look at the most costly operator, the Clustered Index Seek operation. First the properties in SQL Server:
This is where things get a little weird. We have an estimated number of executions at 1000 and an estimated number of rows at 1. The actual number of rows was 22. The estimated cost for the operator is 2.24226. All well and good. But when we look at the same values in the Azure operator:
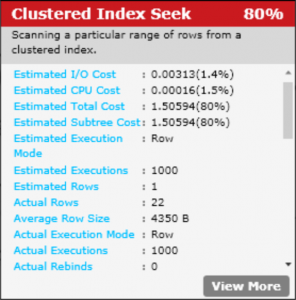
If you look at the Estimated Executions, Actual Rows, Average Row Size, Estimated I/O Cost and Estimated CPU Cost, they’re identical (with some rounding differences). But… the estimated cost of the operation is different; 2.24226 in SQL Server and 1.50594 in Azure. How do I account for the difference? I don’t. I think we’re looking at differences in how the optimizer establishes costs, because everything else looks the same.
Clearly, while the optimizers behave in a very similar manner, after all, we got effectively identical execution plans, they are not the same. The small difference in the cost assigned by the optimizer informs us of this. I’ll have to play around some more with actually complex queries to see what else can be seen.
If you enjoy this kind of drill down on queries, query tuning, execution plans and all that fun stuff, I’d like to suggest you sign up for my full-day pre-conference seminar at the PASS Summit 2012 this fall.


