SQL Monitor has improved a lot over the last couple of years. We have multiple teams building features and addressing issues, and each month when we have a readout of changes, I’m impressed. Since we update the produce every week or two, customers are seeing these enhancements regularly.
Recently I saw a demonstration of the alert filtering improvements and I wanted to share a few thoughts.
Lots of Alerts
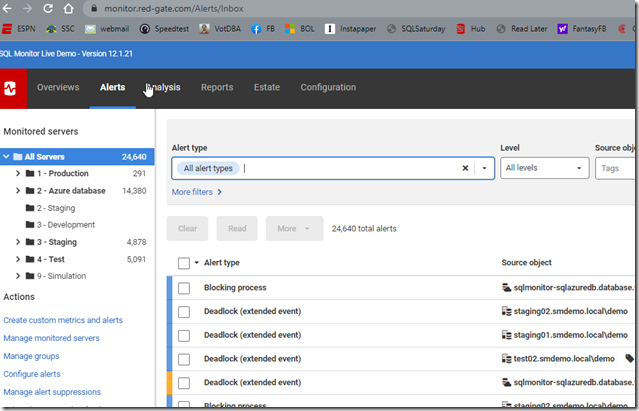
If I go to monitor.red-gate.com, there are a lot of alerts raised across our test systems. While each individual card shows the current alerts, there are more behind the scenes. I’ll write about the cards another time, but in this post, let’s just look at the Alerts tab.
You can see in the image there are 24k+ alerts, and they are distributed across a variety of systems. The left side shows the groupings for databases and a count of alerts. The main section of the screen shows lots of alert types listed, the source database, etc.
One thing I like is the use of color and visual cues. Above, most of these alerts are low level, and bordered on the left in blue. A mid level alert is shown here in yellow. This helps me to triage and decide what to do.
Filtering
While I can click on the server groups on the left and limit the views to a group (or a server), there are still a lot of alerts. The Production group shows 291 below.
The sm-dc2 shows 109 itself when selected.
One of the newer filtering options is that I can click the dropdown at the top of the screen for Alert Type and then limit what I see. The default is all alert types.
However, I can uncheck that and pick just one type, like Machine Unreachable.
Now I only see a couple of alerts.
I can also filter by the alert level, tags, a timeframe, alert property, or alert status. All of this let me focus in on specific aspects of what might be wrong with a database. Using Filters is a good way to more quickly determine what might be happening on a database and how frequently I have these issues. From there, I can use my own skills and understanding of the database to determine what might be causing alerts to fire.
If you give SQL Monitor a try, I’m sure you’ll find it valuable for managing and monitoring your estate, helping you to quickly detect and respond to issues. Download an eval today and give it a try.


