Everyone who has dabbled around with Power BI knows probably the concept of measures (if not, here’s a good refresher). Measures are calculations using the DAX formula language (which kinds of resemble Excel formulas, at least the easy calculations do). They are calculated on-the-fly whenever they are used in a visual such as a chart or a table. In the following matrix, the results of a measure are indicated with the red box:

Measures are calculated on-the-fly because it’s virtually impossible to pre-calculate every possible combination of dimension members. They are an important pillar of your Power BI semantic model. But did you know there are two kinds of measures: implicit and explicit measures?
Implicit vs Explicit Measures
Explicit measures are measures defined by a DAX formula.

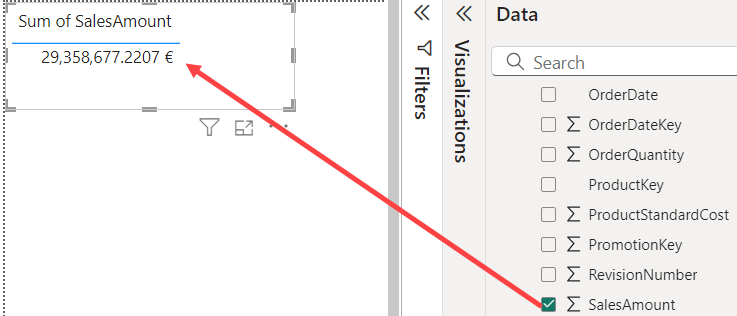
Implicit measures are numeric columns that are automatically aggregated whenever they’re used on the report canvas. For example, suppose we have a numeric column called SalesAmount in a table. As part of its properties, it has the Sum aggregation set as the default.

When we use this column on our report canvas, Power BI will not display the individual row values, but rather use the sum aggregation to give us the sum of the values, without us doing anything (I changed the visual type from the default column chart to a table to make it more readable).
Power BI does this because one of its main purposes is self-service data analytics. It wants to help users out by automatically aggregating columns, instead of requiring users to explicitly create measures.
You can easily distinguish between the two types of measures in the field list. An explicit measure has a calculator icon, while an implicit measure has a summarization icon. In the following screenshot, an explicit measure is indicated in red, an implicit one in green.
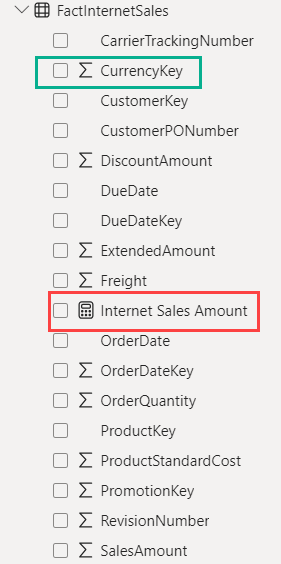
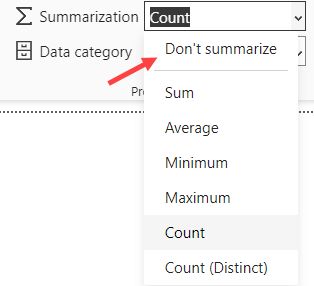
As you can see from the example, even columns that are not meant to be used as a measure can be used as an implicit measure, just because they’re numerical, such as the currency key column for example. To avoid people using those columns accidentally, or to prevent Power BI to create incorrect charts (e.g. when you use a year column, you don’t want that summarized on a timeline), you can set the default aggregation to Don’t summarize.
Now that we’re clear on what the difference between the two types of measures are, let’s explain why you shouldn’t use implicit measures.
Reasons for not using Implicit Measures
Just to make sure there’s no confusion: there’s no performance difference between the two types. You can make a bunch of visuals using either implicit or explicit measures, and you probably would never notice the difference. However, implicit measures only support basic aggregations, such as sum, average, min, max and count (distinct). For anything more complex, you must use a DAX formula.
Now, suppose we have our sales amount column, and we just want to use the sum aggregation. What’s stopping us from using the implicit measure? For small, simple models, you’re probably fine, but once the model starts growing and becomes more complex – and maybe multiple developers start working on the project – you might want to promote good dev practices, such as:
Intent
By using an explicit measure like SUM(FactInternetSales[SalesAmount]), you clearly define what the intent of the measure is. Sum, and nothing else. If you use an implicit measure and someone else changes the default summarization from sum to average because they needed it in a visual, all your visuals will suddenly show different results.
Reuse
You can reuse measures in other measures. If you define an explicit measure over the column, you can write something like this:
CALCULATE(mySalesAmount,Region = 'Europe')
If at some point you might need to revisit your definition of mySalesAmount – because business logic has changed – you can just update this base measure, and all other measures that have a dependency on this measure can be left as-is. However, if you used an implicit measure like this:
CALCULATE(SUM(FactInternetSales[SalesAmount]),Region = 'Europe')
You will need to update every single measure where you used the SalesAmount column.
Both reasons are sane development practices, but they don’t impact functionality. Report viewers won’t know the difference if you used the implicit measures instead of the explicit ones. So, let’s talk about one important feature that doesn’t work with implicit measures.
Excel and Implicit Measures
When we connect with Excel to your Power BI semantic model in the Power BI service (using the Analyze in Excel feature), we get the following field list for the same model used in the previous examples:
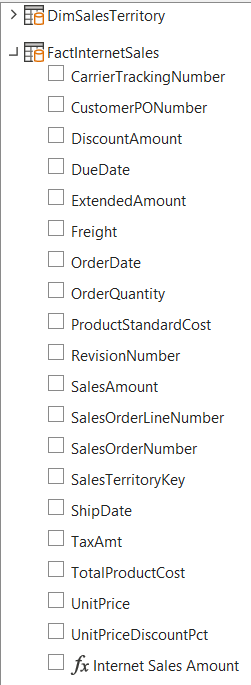
We can only see the explicit measure, there are no implicit measures that you can use. That’s because implicit measures are created in DAX, while Excel only uses the query language MDX (which is used in Analysis Services Multidimensional). Power BI knows how to interpret MDX so it can provide data to Excel, but Excel cannot use DAX. In other words, if you want users to be able to use your Power BI model in Excel, you must create explicit measures.
Different Behavior Between Explicit and Implicit Measures
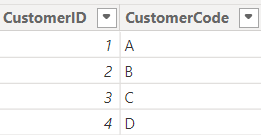
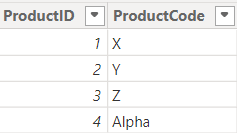
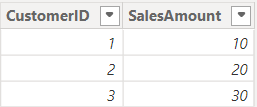
In some cases, an implicit measure might not return the results that you’d expect. It’s best to illustrate this with an example. Suppose we have the following tables in a Power BI Desktop model:
DimCustomer
DimProduct
FactCustomerSales
FactProductReturns
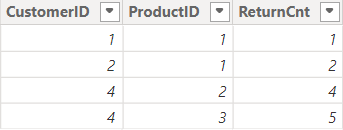
Important to note is that Customer Sales doesn’t have sales for customer D (ID = 4), but the Product Returns table does have returns for this customer. Not all products have returns. The following relationships are created in the model:
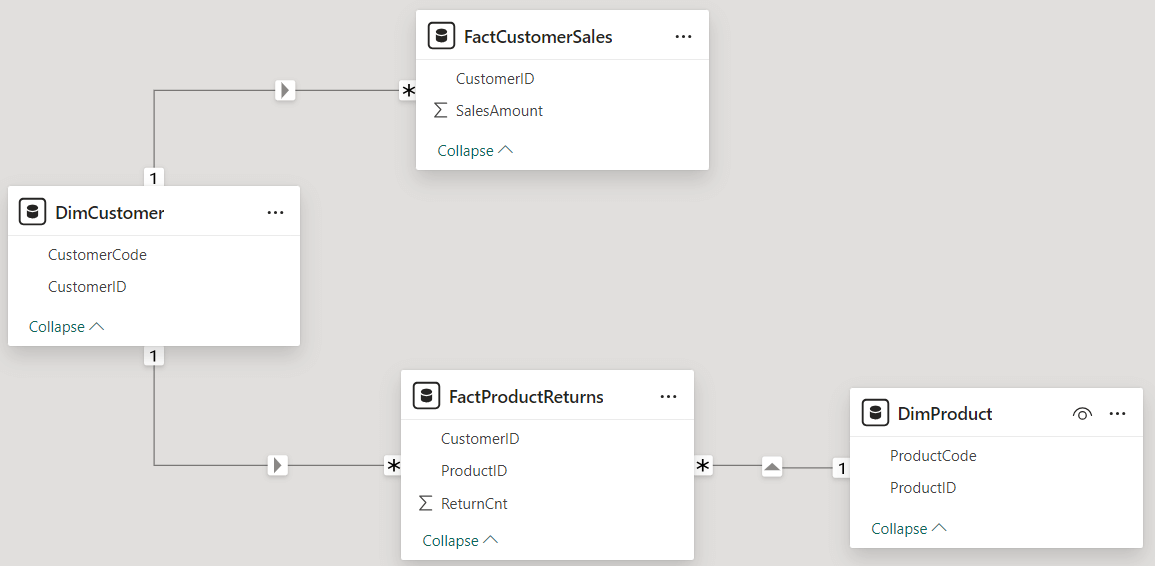
The Customer dimension is a conformed dimension for both the facts, while the Product dimension is only related to the Product Returns fact table. As you can see from the screenshot, there are implicit measures for the SalesAmount and the ReturnCnt columns.
When we combine data from both fact tables and only customer in a single visual, we get this result:
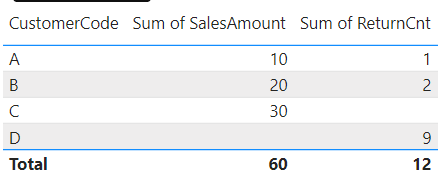
There is a blank value for the Sales Amount of customer D, and a blank value for the returns count for customer C, as expected. However, once we add the Product dimension into the mix, something strange happens:

Customer C suddenly disappears from the visual, even though the Sales Amount measure returns a value, which means it should be included! The grand total does return the correct result, which makes it even more confusing!
Now, let’s create two explicit measures:
Sales Amount Expl = SUM(FactCustomerSales[SalesAmount])

Returns Count Expl = SUM(FactProductReturns[ReturnCnt])
When we replace the implicit measures with the explicit ones, the table returns these results:
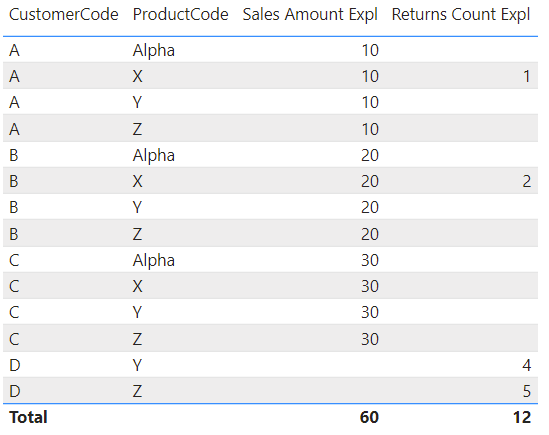
Customer C is included this time, but the Sales Amount is repeated for every product. These are actually the correct results (the grand total line is also correct, which does seem confusing because of all the repeating values). The “problem” here is that we’re mixing data from two fact tables, and they’re on different grains.
Let’s look at the first row to find out what’s going on. There are no returns for product Alpha by customer A. But customer A does have a sales amount (a measure that doesn’t return a blank value). Since there’s at least one measure that doesn’t return a blank value, the row is not filtered out. The issue is that for every combination of customer A and a product, the measure sales amount will return the same value, so it gets repeated over the different rows.
Why doesn’t this happen with implicit measures? I struggled to understand this at first, but Power BI MVP Kurt Buhler (Twitter | Bluesky | Blog) showed me that the key to the solution is in the generated DAX. When we look at the DAX query generated by the second table with implicit measures, we can see that a filter was added to remove rows without product returns:
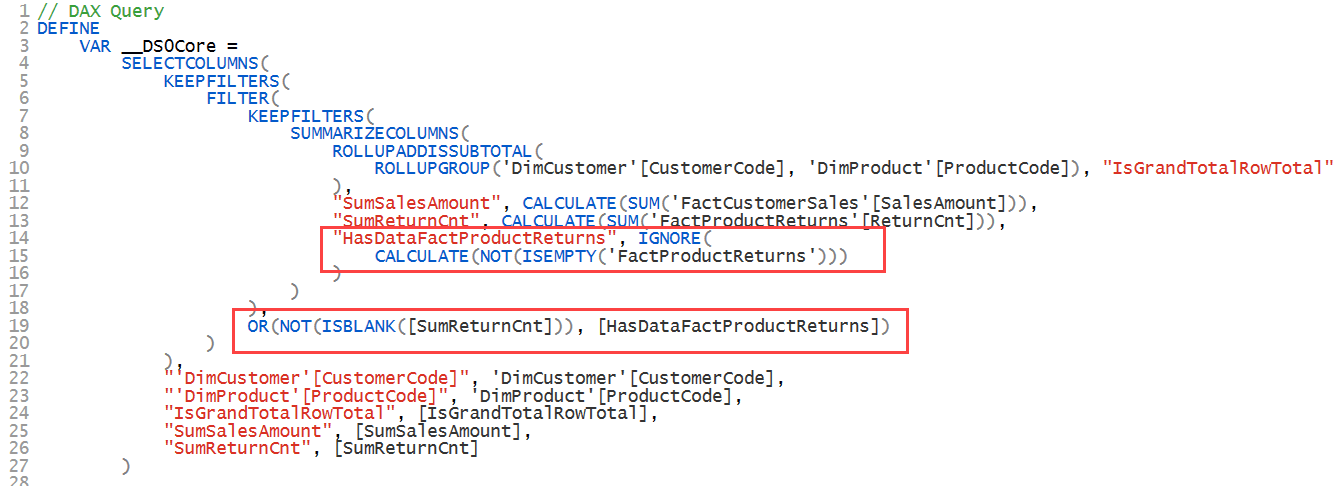
When we look at the DAX query generated by the same table but with explicit measures, we get a much simpler DAX query and without an artificial filter being imposed on it:

This means that using explicit measures instead of implicit measures can return different results in ways that you would not expect.
To be complete: how can you avoid the issue of repeating values in a visual? In this case, it would have been better to use a table visual for each grain.

The left table displays data from both fact tables but on the customer level. In the right table, we have columns from both the Customer and Product dimension, but we don’t include sales amount since that data is only available at the customer level. The right table can function as a drill-through table for the left table.
UPDATE - Input from the Community
Some readers have let us know there are even more reasons not to use implicit measures, as for example in this reddit thread. One big reason is when you're using calculation groups, another one is field parameters.
Conclusion
In this article we demonstrated why it’s beneficial to use explicit measures instead of implicit measures. Not only does it promote good coding practices, but implicit measures are not even supported in Excel. Lastly, implicit measures might return results that you don’t expect in certain use cases.


