Sometime it can be hard to figure out what is going on with SQL server. Issues that occur at odd hours or that are intermediate and are hard to replicate can be especially difficult to pin down. There are some great tools available that will monitor and record SQL server metrics so you can have point in time visibility that are especially helpful for these kinds of problems, but can also be very expensive. Or you can use a tool that comes with Windows and an open source program to give you the same type of results for free.
Windows comes with a great, lightweight monitoring tool called Performance Monitor (PerfMon) that will record tons of parameters over a given time range so you can see what is going on with CPU, disk IO, memory and hundreds of other counters. The only problem is trying to read and decipher the data once you have it. It can be daunting to say the least.
That is where PAL (Performance Analysis of Logs) come in. PAL is an open source program that can be found on the CodePlex site that takes a PerfMon data file and renders it in easy to read HTML report format. It can help you find out what is going wrong (or right) with you SQL instance. It even has easy to use wizared and templates for SQL Server that make generating the report a snap.
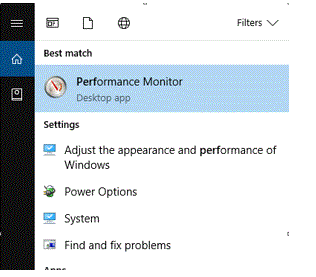
So, let’s get started. First, we need to set up a PerfMon session and capture some data. To start PerfMon just search for it and click on it to get started.
Once it comes up you will want to start a new data collection set for SQL server.
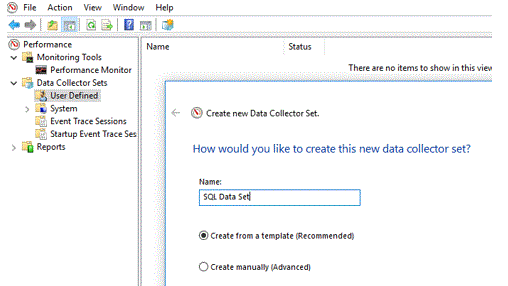
Now let’s add our counters. There are many, many counters to choose from to create a custom data set. If you are not familiar with the custom counters, I would strongly urge you to experiment and become familiar with them. For this example, we are going to use a pre-made default template that looks at system diagnostics.
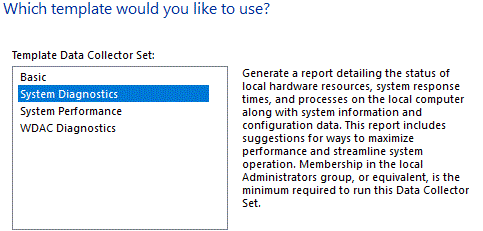
Once you have your data collection setup, you can set it to run for specific times or conditions. I normally like to have it run for a 24-hour period as I find that to be a good way to make sure I capture enough data for a good sampling but it does not create an overly large data file.
Now that we have our PerfMon file, we need to download and install PAL. This program and installation instructions can be found at https://pal.codeplex.com/. It is an open source program that is extremely easy to use and provides a wealth of inforamtion. Make sure you read the program requirements and prerequisites to ensure you can install PAL on your system.
Once you have installed it, open it and use the PAL Wizard to get started. First, we point it towards the PerfMon file you captured.
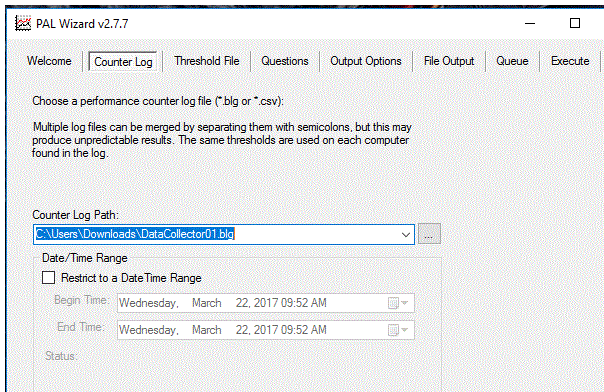
Then select the template you want to use to generate your report.
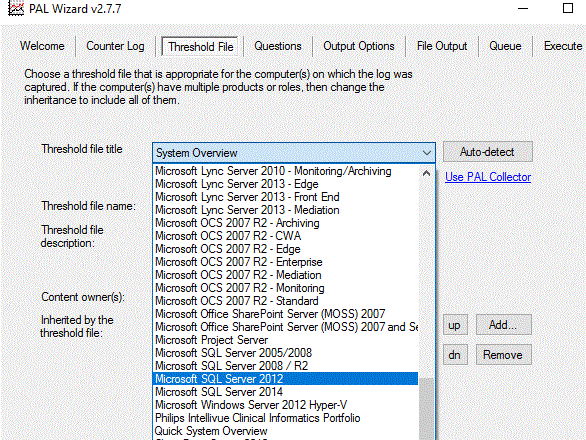
As you can see, there are many premade templates to choose from. The template will automatically set threshold alerts based on the system you are examining. In this case, we will select SQL Server 2012.
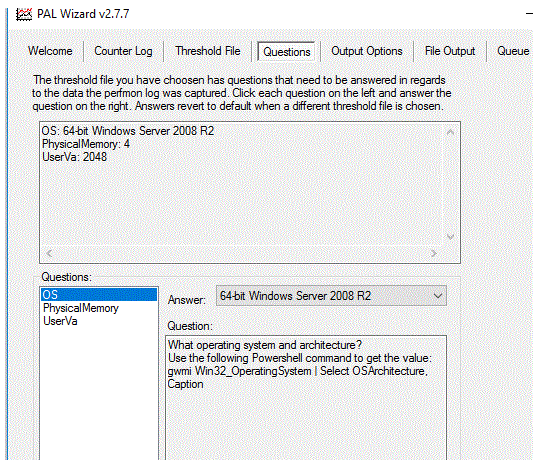
Next, tell PAL the type of server you are looking at. It needs this information to create a report that is tailored to your system. Remember, this is asking about the system the file was generated on, not the system you are running PAL on.
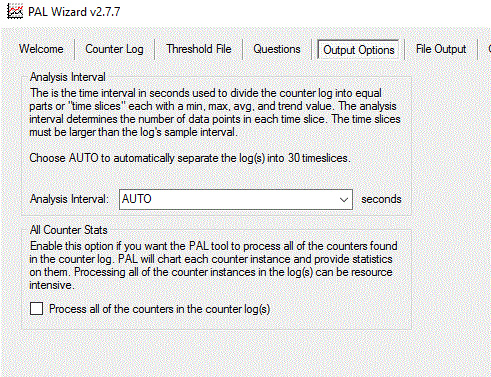
Then chose the Output options. You can customize the time intervals that are analyzed and look at all counters captured or just those associated with the server type template you selected. I normally recommend just look at the counters for that template.
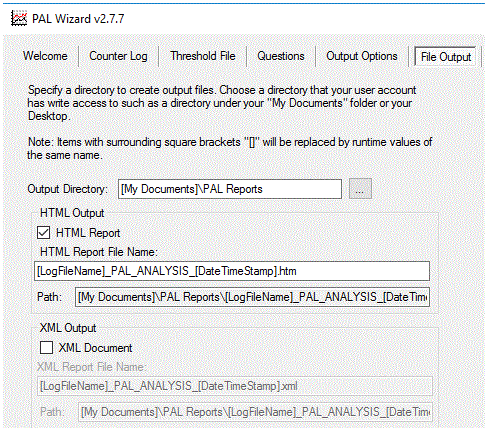
Finally, select the file output type and location. I normally just select the defaults here but you can customize it if you wish.
After you confirm your choices, execute the report generation. PAL uses PowerShell to process the PerfMon file and render it to HTML. Depending on your system and the size of the PerfMon file, this can take a few minutes to complete. When it is done, you will have a concise, easy to read HTML formatted document that will highlight your problem areas as well as give advice on what the problem might indicate.
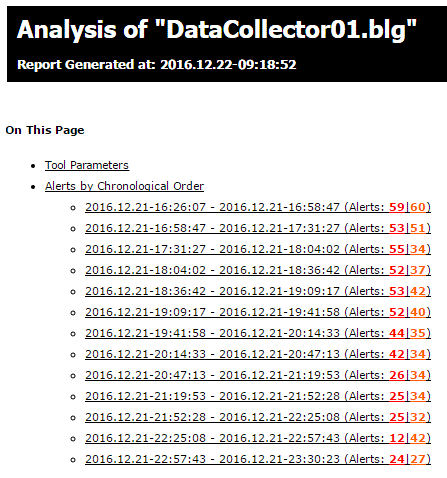
Select an alert to see details.

The report can warn you of issues with disk, IO, CPU, Memory and much more. Using this information, you can narrow down the focus of your investigation and hopefully find the causes of you issues.
These tools are not magic, you will have to know how to read and understand the report, but they can help you to figure out what is going and when. They were able to help me figure out that my IO nosedived between the hours of 1 and 3 am every night and from that I was able to find another program using the same SAN disks that was the culprit.
So, in closing, there are some great tools that are easy to use and free that can help you solve your SQL issues and make life much easier.


