Being able to understand and analyze execution plans is an important and beneficial skill for SQL Server database administrators and developers alike. An execution plan documents the estimated cost of a query, the indexes used, and the operations performed. All of this information is vitally important in attempting to speed up a slow performing query.
This article is part of a three part series on graphical execution plans. Part 1 explains what execution plans are and discusses the differences between estimated and actual plans. Part 2 shows how to create both estimated and actual execution plans. Lastly, Part 3 takes a look at a simple graphical execution plan, and discusses several of the most common operators used in a query.
Reading an execution plan
Let's examine how one looks at an execution and plans garners information from the plan.
The Basics
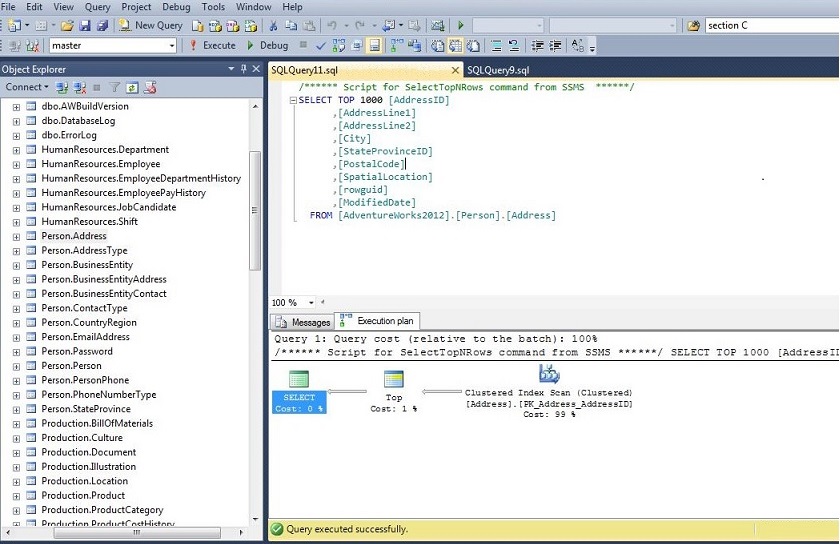
Figure 1 shows the estimated execution plan for a simpe select statent on the [AdventureWorks2012].[Person].[Address] table. As you can see, it is made up of icons that represent the operations and arrows that join the various operations. The arrows all point left, showing that the plans starts to the right and works left. To read the plan chronologically, start with the right-most operations and work left. Also, the relative thickness of the arrows is an indication of how much data is being passed from one operation to the next.

Figure 1: A Simple Estimated Execution Plan
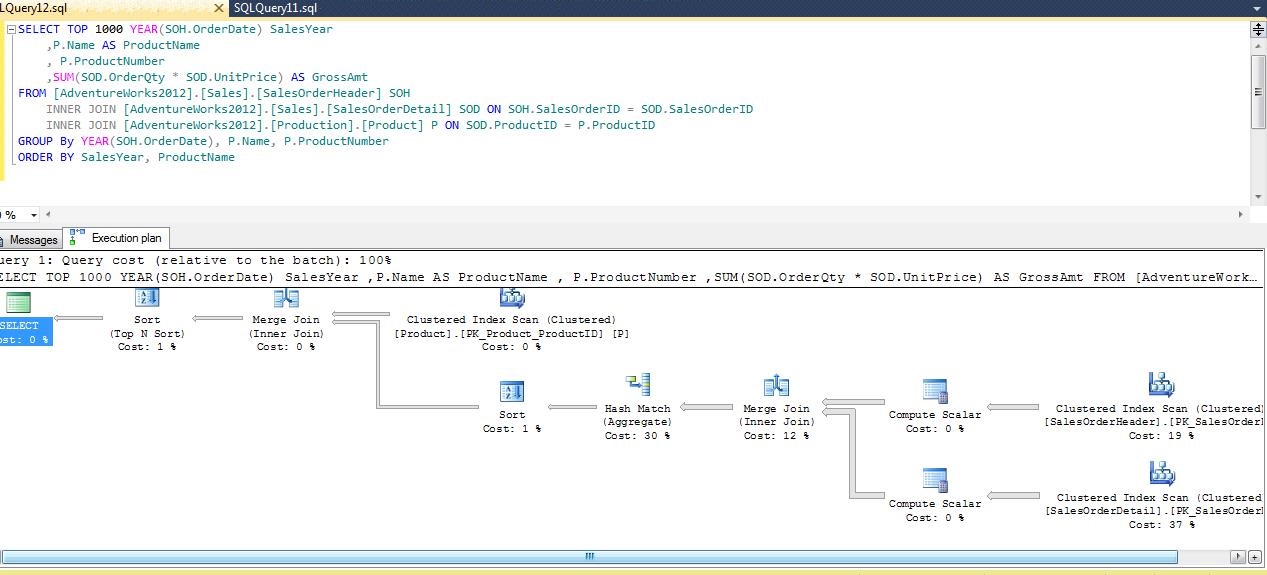
In Figure 2, the top operation has a thinner arrow than the two operations below it. The top operation is, therefore, outputting fewer rows.

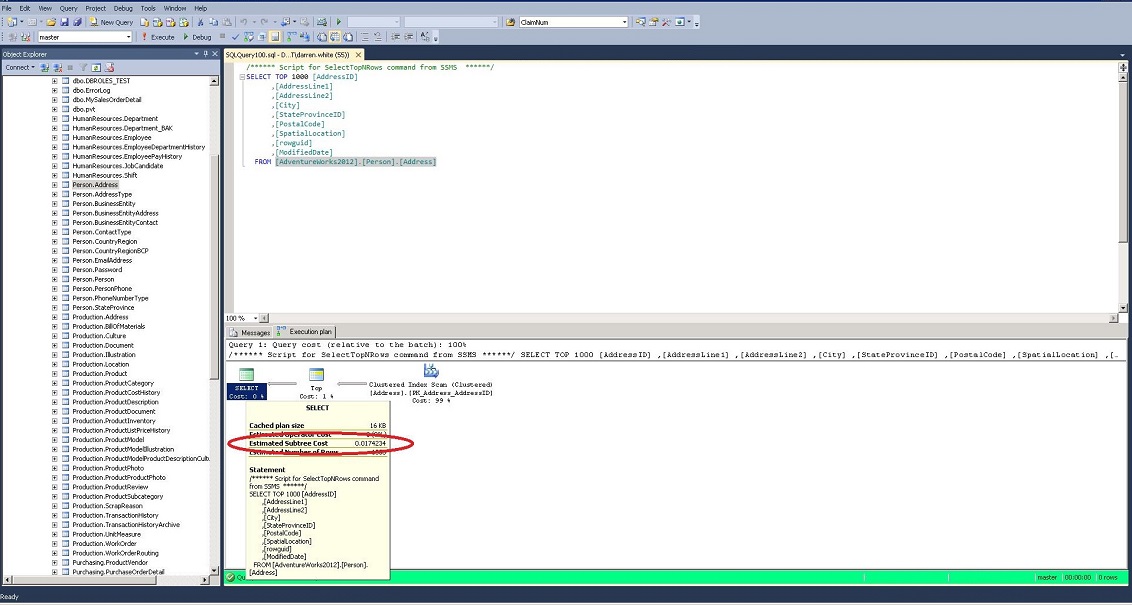
After creating the plan, a good place to start is to look at the total cost of the query. The total cost will be located in the last operation. This will be the upper left-most icon, which in this case, is a Select operation. Hovering your cursor over the Select icon will give you a ToolTip with information about the operation (Figure 3).
We are interested in the Estimated Subtree Cost. The total cost is a relative value that gives a better sense of whether the query will perform quickly or not. It is made up of I/O cost and the CPU cost. The Operator Cost is a sum of the I/O Cost and the CPU Cost. In this case our query has a cost of well under 1. It will probably execute relatively fast. On the other hand, a query with a total cost in the thousands will probably take quite a while to complete. Several factors affect the estimated cost. Not only the number of rows and indexes on the underlying tables and views, but also environmental factors such as the number of CPU’s and hard drive are used to calculate the costs.

After examining the total cost and getting a relative sense of how long it will run, next, take a quick look at the operations performed from right to left. In Figure 1, first, there is a clustered index scan. A scan indicates that the query is not very selective (see Index/Table Scan under Frequent Plan Operations for more details). In this particular case, it would be a product of not having a where clause. We also have a TOP operation, which returns the top 1000 rows from the query. Finally, there is a select operation that is returning the columns specified in the select statement.
Once we get an overall sense of what the query is doing, we want to focus on the operations with the highest cost. The plan lists the percentage of the total cost for each operation underneath each icon. From Figures 1 and 2, we can see that the clustered index scan accounts for 99% of the cost of the query. We would want to focus our attention on this operation.
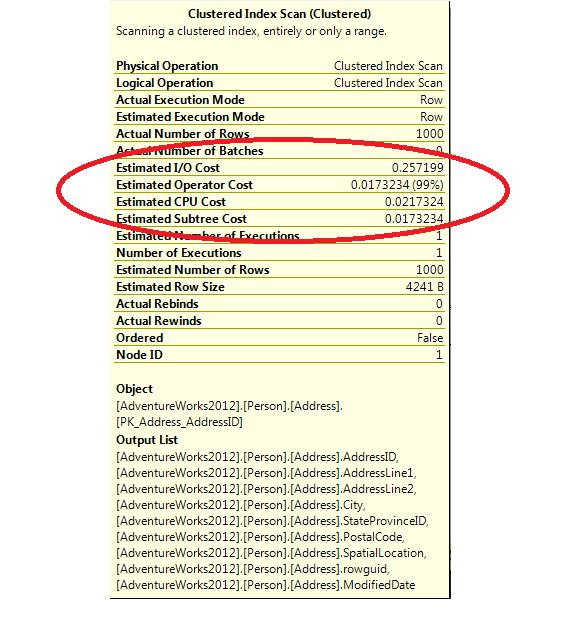
Looking at the tool tip for this icon (see Figure 4), you will notice that there are four costs listed. The costs are broken down for each operation by the CPU cost and the I/O cost. The Operator Cost is the addition of the CPU and I/O Costs. The Sub Tree Cost is the current Operator cost, plus the entire Operator costs of the operations that preceded it. If you start with one of the right-most operations and follow the arrows to the left, you will see the Sub Tree Cost for each successive operation accumulate. As we examined earlier, the Sub Tree Cost inthe left upper-most operator contains the estimated cost for the whole query.

Figure 4: Plan Costs
Frequent Plan Operations
Below are some of the most frequent operations that appear in query plans.
Index/Table Seek – When a seek is performed, SQL Server is able to efficiently look up specific values or a selective range of value in the index. Using a library analogy, it would be like going to the library computer, looking up the location of a book, and going to that location to get the book.
Index/Table Scan - In a scan operation, SQL Server read through an entire table or index. To use the library analogy again, this would be equivalent to searching every shelf in the library until you found the book you wanted. Try doing that in a large university library! Scans indicate that the search criteria was not selective enough to warrant using a seek operation. If there is no index on the column(s) being sought or the number of values to return is a large percentage of the values in the index (low selectivity), it can be more efficient to look through all the values. If you feel you have a WHERE clause or JOIN that is specific enough to warrant the use of an index, make sure the columns involved are properly indexed.
Seek /Scan with Bmk predicate - When looking under the Seek Predicates section of the tooltip on an index seek or scan, you will sometimes see a predicate value like Bmknnnn where nnnn is some number. This indicates that SQL Server will create a bookmark to be used in an Index or RID Lookup. When a bookmark is present, the index seek/scan is part of a two-step process where the optimizer will need to perform a lookup on the clustered index (or the table if no clustered index exists) after creating a data set with the bookmarks. See the section on Key/RID Lookups for more information.
Joins
SQL Server makes use of three types of join operations:
Hash Match/Join –A hash match or join can be used in joins (hash join) and group by’s (hash match). In this operation, the query optimizer builds a hash table from the upper of the two tables (as seen in the graphical plan) being joined. This is referred to as the build table. Each row of the lower table (referred to as the probe table) then searches the build table for matches. In the case of a group by, the results from the previous operation are used as both the build and probe tables (see Figure 7). The key to the efficiency of this type of join is the size of the build table and the amount of available memory on the server. The optimizer will create the build table in memory if it is small enough. If this is possible, a hash match can be quite fast. On the other hand, if the build table is very large, the process becomes a recursive routine and can be very slow. When this occurs and the cost of the hash match is a significant percentage of the plan, you should look to make the query more selective or consider the addition of a new index. Hash joins and matches may need to wait for memory to free up before beginning execution.
Merge Join – When the upper table (as shown in the graphical plan) in a join is large, a merge joins will be the fastest type of join. The cost of the join is related to the sum of the rows of the two tables (# row in top table + # row in bottom table). The key to the efficiency of a merge join is that both of the joined tables must be sorted on the joining columns. If the tables are not already sorted, the optimizer will sort the tables first. In this case, you will see a sort operator directly before the merge join operator. Sorting operations can be very costly, so if the plan shows a sort operator with a high cost before a merge join, you probably want to investigate adding an index on the join columns.
Nested Loop – The cost of a nest loop join is related to the product of the number of rows in the two tables (# rows in top table X # row in bottom table). Although this join is less efficient than a merge join, its overall cost can be lower than a merge join when the tables are not sorted or lower than a hash join when the upper table is large. Again, if the cost of the operation is a high percentage of the cost of the plan, then look to make your query more selective or add an index.
Key/RID Lookup – A lookup occurs when a seek or scan is performed on a non-clustered index, and all of the data being sought is not contained in the index. When this occurs, a key lookup is performed on the clustered index, if it exists, or row identifier (RID) lookup if the table has no clustered index. Lookups can be expensive operations and should be avoided if possible. To eliminate lookups, add the columns in the select statement to the include clause of the non-clustered index, if feasible. What if you have so many columns in the select statement that it is not feasible to include them all? The next best thing is to make a non-clustered index that is more selective than the index currently being used. That is, if you cannot remove the lookup, try to reduce the number of rows being fed into the lookup.
Compute Scalar – This operation performs a calculation to produce a single value. This is often the result of a scalar function, a math calculation, or a string concatenation. Be aware that the optimizer cannot estimate the cost of scalar or multi-statement table-valued functions. When one of these functions appears to be slowing performance, try to convert it to an inline table function.
Concatenation – This has nothing to do with string concatenation; rather, it is the concatenation of sets of data. It is most often used for combining data in UNION ALL operations.
Sort – The sort operation simply takes unsorted data as input and outputs a sorted set. Sorts can be very costly on large data set. Also, sorts may need to wait for memory to free up before beginning execution. Plans with a high sort cost should be examined for optimization.
Parallelism – If SQL Server is located on a machine with more than one processor, it has the option of splitting out operations across processors. In fact, if there are multiple processors, the optimizer creates two plans, one with parallelism and one without. SQL Server then decides which one will most likely execute in the shortest amount of time. Parallelism involves the splitting of data to spread operations across processors and the merging of the results. If the parallelism operation has a high cost, you can test the MAXDOP query hint on a query [OPTION (MAXDOP 1) ] to force it to use one processor.
For a complete list of operators, see the TechNet article Showplan Logical and Physical Operators Reference.
Conclusion
Reading graphical execution plans is an effective skill in query tuning. This article series is an introduction to the topic. I welcome your comments about further articles. Also, if you are interested in reading more about the topic, Grant Fritchey’s book SQL Server Execution Plans provides the best and most comprehensive coverage available.
References
- Analyzing a Query, TechNet Library - http://technet.microsoft.com/en-us/library/ms191227(v=SQL.105).aspx
- Checklist for Analyzing Slow-Running Queries, TechNet Library - http://technet.microsoft.com/en-us/library/ms177500(v=sql.105).aspx
- Fritchey, Grant (2008), SQL Server Execution Plans, Simple Talk Publishing *
- Showplan Logical and Physical Operators Reference, TechNet Library - http://technet.microsoft.com/en-us/library/ms191158.aspx
* The 2008 edition was used for this article, but a second edition was published in 2013.


