Rodney Landrum demonstrates an ingenious way to monitor blocked SQL Server processes across all your servers, using nothing but SSRS.
To begin, I should confess that I have a very soft spot for SQL Server Reporting Services, and not just because I've written two books and several articles on the technology.
To me, a DBA and data analyst, SSRS offers the same sort of excitement that I felt when discovering the Internet for the first time many years ago, back when it was little more than an interesting new type of Bulletin Board System (BBS), and when a 56K baud modem and a computer were your shovel and treasure map.
Like the Internet, SSRS's flexibility opens wide the door of creativity and, even now, having worked with it for several years, there is always something new and interesting that I can create.
But enough nostalgia. All that SSRS requires of you is a vision for a report, a few minutes of forethought, and the tenacity to work through whatever unexpected obstacles that you will surely encounter. In my experience, these obstacles are easily overcome once you can master the syntax of expressions and the power of report parameters.
Three reporting requirements
Recently, I finally sat down to tackle three reporting challenges that I'd set for myself many times, but never actually got round to solving:
- Seamlessly merge into one report static and real-time data from different data sets.
- Create the equivalent of a "framed" report, whereby the list of hyperlinked servers on the left hand side of the report is maintained on the report, even when the center content is updated due to a navigational click by the user.
- Provide a hyperlinked list of servers that the report will dynamically connect to, similar to a parameterized list, but in the report itself.
The techniques used to achieve the goals involved use of several expressions and report parameters, and can be incorporated into any report. I hope they are as useful to you as they have been to me.
To demonstrate these three techniques, I chose a simple administrative report that DBAs can use in lieu of, or in addition to, Activity Monitor in SQL Server Management Studio. What is nice is that the report offers a single-click solution, whereas Activity Monitor requires more extensive navigation and many open Windows in order to monitor more than one server.
The report, shown in Figure 1, shows server names and the real-time processes executing on them at the time the report is generated.
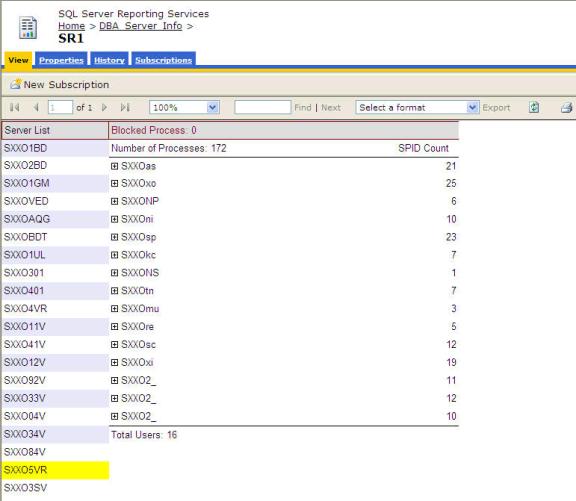
Figure 1
Getting the static and real-time data
The first goal was to combine static and real- time data into the same report. This was straightforward enough to achieve, by combining a dataset that returned server names and another data set that dynamically connected to those servers. The server list on the left of figure 1 is generated from a repository database that is populated with SQL Server administrative data several times a day. One of the tables in the repository holds the server names, so the dataset was populated using a simple SELECT statement to return those SQL Server names.
The content on the right comes from the second data set and is nothing more than the result of executing the system stored procedure, sp_who2. This data set provides the realttime data for the report.
So, getting static data from one data set and realtime data from another is easy. The trick is in combining the two in a meaningful way. Let's break apart the report, section by section, so that all the parts work together to meet my original three challenges.
Notice that the server list on the left has an alternating color scheme, except for the focus server, which has a yellow background. This is accomplished using a simple expression for the background color:
=Iif(Parameters!ServerName.Value = Fields!Server.Value,
     "Yellow",iif(RowNumber(Nothing) Mod 2, "Lavender", "White")
The expression evaluates a parameter, ServerName, and sets the background to yellow if the parametervalue is equal to that of the Server field. Otherwise, it fits the alternating pattern of lavener and white.
Note:
In addition to providing intuitive color coding, the ServerName parameter also performs a couple of other very important tasks in the report, which we will cover shortly.
The "framed" report
It is important to remember that the server list on the left, color coding and all, should stay in place even when we navigate to another server to see it's real-time processes. Reporting Services offers several navigation actions, such as jumping to a URL, jumping to a book mark or jumping to another report. All of these, however, take the focus away from the current report.
So, the question is, how can you create a report that has a navigation or hyperlink action from a report item but does not take focus away from the current report? This is where the creativity comes in: you create two identical reports that hyperlink to each other and pass parameters back and forth based on the user's selection.
In this case, the two reports – we will call them SR1 and SR2 – will both show the same server list with the same color coding, but the "focus" server will be in yellow.
The user (most likely the DBA) will launch SR1, see the list of servers on the left and the formatted real-time results of sp_who2 in the center. As the user clicks any server on the left, SR2 will be called and rendered, showing yellow for the focus server and with sp_who2 results specific to the selected server. When a server is selected in SR2 the link is passed back to SR1, and so on. To the user, it is one report that is refreshed with server-specific data. To us SSRS magicians, it is two reports seemlessly integrated.
This satisfies our second goal of having a "framed" list of servers that does not deviate after hyperlink actions are performed. Figure 2 shows the report after linking to SR2, changing focus to the selected server and updating the report content without changing the overall format. Notice one of the main differences, aside from the highlighted server SXXO2BD, is that the report is now SR2.
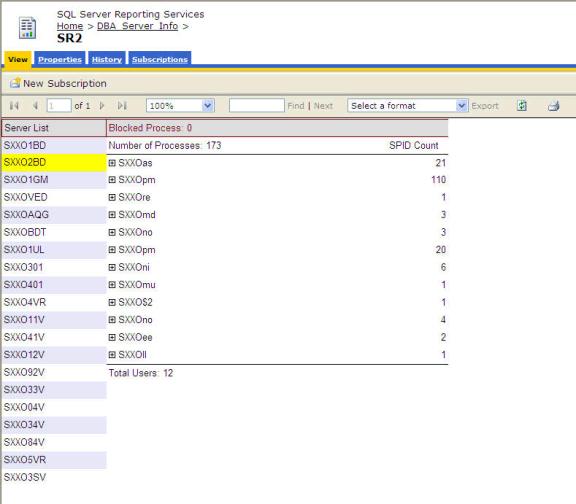
Figure 2
Dynamic connections
Now, we should take a closer look at the all-imporant parameter, ServerName, and how it is used many times within the report to set connection strings dynamically and control the report flow.
In Figure 3, you can see the connection string for the sp_who2 stored procedure. It is an expression that incoporates the value of the ServerName parameter. The value will change many times during report execution, based on user selection. I have seen coverage of dynamic connections in other articles, based on a parameter, but none of them tied a parameter value to a field value, and based on a hyperlink action. We will do that next.
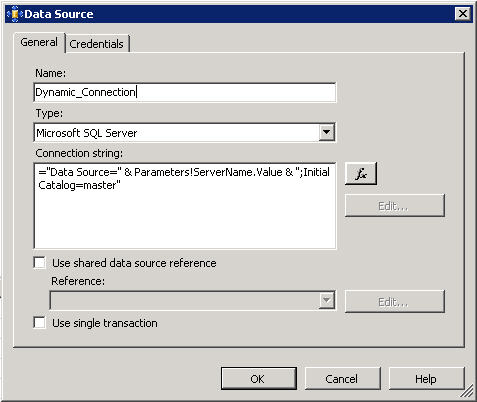
Figure 3
The connection string for the sp_who2 stored procedure will be dynamic based on the server, so the next step is to assign the parameter value. The report parameter itself is simply a string, as you can see in Figure 4.
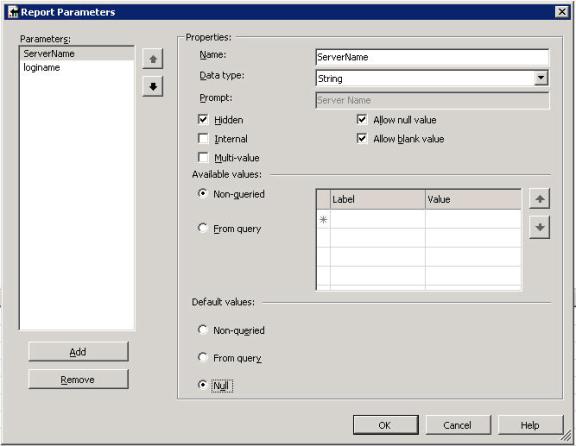
Figure 4
It would be easy enough to select the value from a drop-down report parameter list, but that is boring. We want the list in the report since that was the goal, after all. We need a way to attach the ServerName parameter value to the un-moving server list in the report itself. This is accomplished via the hyperlink action linking report SR1 to report SR2. On the Navigation tab in the field properties, you can see that the Jump To Report option takes a parameter and further, that the parameter can be associated with a field value. Perfect!
What this means, as you can see in Figure 5, is that when SR1 "jumps" to SR2, our identical report, it will pass the ServerName parameter, holding the value of the Server field.
It should be noted that, on Report SR2, all that is required is to set the Jump To Report value to SR1, and the loop is created without a normal parameter list. In fact, we hide the ServerName parameter in both reports, SR1 and SR2. Why clutter the yard with unused toys?
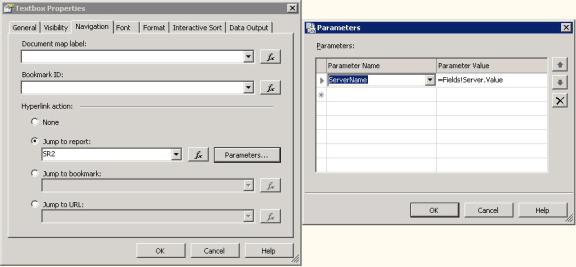
Figure 5
Now that we can navigate between the two reports, refreshing the content for each server dynamically, let's look at the content itself, which will be the output of the sp_who2 system stored procedure.
The sp_who2 output
It is really a simple table with a few groupings and aggregates showing running processes on each server. Most DBAs are familiar with the results of sp_who2 but what makes this report a useful first-response tool, is the summarized information that provides the at-a-glance perspective that Activity Monitor does not. The report takes all of the records returned from sp_who2, aggregates them using grouping functions in the report, counting the number of process that are blocked. This is determined by the BlkBy field. If the value is " ." (two spaces and a period) then the process is not blocked by another process. However, if the process is blocked, then the blocking SPID is returned. The simple count at the top of the report, derived from the following expression, is enough to direct the DBA's attention to a potential issue:
Count(Iif(LTrim(rtrim(Fields!BlkBy.Value)) <> ".",ltrim(rtrim(Fields!BlkBy.Value)),Nothing))
In Figure 6, there is a simulated block, created by issuing a BEGIN TRAN statement followed by an UPDATE without a COMMIT or ROLLBACK and then, in a new query window, executing a SELECT statement from the same table being updated.
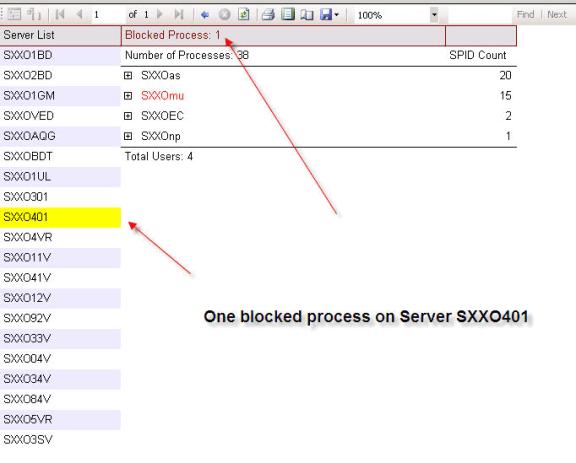
Figure 6
The report content is grouped by the Login with a total count of all processes and then an individual count for each login. Note too, in Figure 6, that the user who is experiencing the blocked process is colored red. This is easily done by setting the text color of the textbox for the login field to the following expression:
=Iif(Count(Iif(LTrim(rtrim(Fields!BlkBy.Value)) <> ".",ltrim(rtrim(Fields!BlkBy.Value)),Nothing)) > 0,"Red","Black")
It is easy to determine, at this point, that the blocking SPID is for the user in red. The report uses the drilldown functionality in SSRS so that groupings of data can be hidden until expanded by user selection. This is the case with the Login grouping. We now know, for example, that there is a blocked SPID and we know which user is experiencing the block. We can now drill down to see both the application and the user SPID, as well as the blocking SPID, see Figure 7.
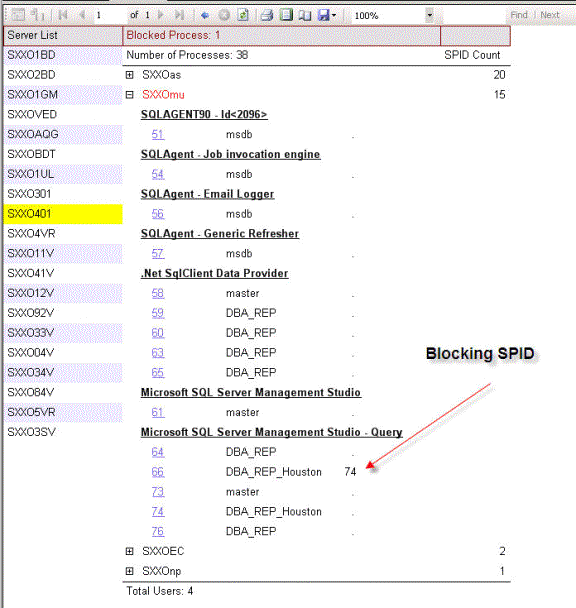
Figure 7
The application that is causing the block, my simulated block, is SQL Server Management Studio (SSMS), and the blocking SPID is 74, for the database DBA_REP_Houston.
Report Layout
Finally, I want to show the simple layout of the reports. As you can see in Figure 8, the report consists of two aligned tables, using two separate datasets. The groupings and aggregate functions are all controlled in the report, as opposed to performing the same functionality in the driving T-SQL code for each dataset. The performance, even allowing for switching between servers to pull down the real-time data from sp_who2, is exceptional and has minimal impact on the target servers.

Figure 8
Summary
Using this report, once a blocked process is discovered the DBA can respond via other tools, like Activity Monitor, or use T-SQL code to kill the offending process, or contact the user directly. Another step for this report, using the same techniques demonstrated here, would be to pass the blocking SPID to a data set that issues a DBCC INPUTBUFFER statement, taking the SPID as a parameter and displaying the output query in another table. Knowing, as I do, that SSRS will format the output without special coding and that DBCC commands can be successfully executed as a dataset, more possibilities open up, as they always tend to do with this ever-flexible technology. –
As an addendum…I did ultimately finish the DBCC INPUTBUFFER report. The two report RDLs and data source RDS can be found, along with instructions on loading them, in the code download for this article. I hope you enjoy them. As always, if you have any questions, comments or high-paying consulting jobs…contact me at rlandrum13@cox..net.


