Introduction
On a not-so-busy day, I received an alert saying tempdb was at 90 percent of the drive size with only 10 percent remaining. This was a SQL Server 2014 instance hosting AlwaysOn secondary databases.
Explanation
I logged onto the server to check what was running in tempdb. Everything looked normal, and the daily routine queries were running. I checked memory and the CPU, both were fine but the tempdb kept filling. After a while, I ran the below query to see the tempdb space usage.
SELECT GETDATE() AS runtime,
    SUM(user_object_reserved_page_count) * 8 AS usr_obj_kb,
    SUM(internal_object_reserved_page_count) * 8 AS internal_obj_kb,
    SUM(version_store_reserved_page_count) * 8 AS version_store_kb,
    SUM(unallocated_extent_page_count) * 8 AS freespace_kb,
    SUM(mixed_extent_page_count) * 8 AS mixedextent_kb
FROM sys.dm_db_file_space_usage;
Here are my results:

Note: There are many AlwaysON secondary databases hosted on this server and all the queries that run against the secondary databases are automatically mapped to the snapshot isolation transaction level. The snapshot isolation level copies row versions into tempdb. The Version_store_kb column in the above query shows the current size of all the version stores.
I noticed version_store_kb was at 850 GB which caught my attention. At this point, Tempdb had reached a size of 950GB, out of which the Version store was using 850 GB. This indicated there were sessions using the version stores in tempdb. However, when I looked at the active sessions on the server, just the routine queries were running, which in the past had never caused any issues.
select r.session_id,
       r.cpu_time,
       p.physical_io,
       t.text,
       substring(t.text, r.statement_start_offset/2 + 1, case when r.statement_end_offset = -1 then len(t.text) else (r.statement_end_offset - r.statement_start_offset)/2 end) as text_running,
       p.blocked,
       db_name(p.dbid) as dbname,
       r.status,
       r.command,
       r.start_time,
       r.wait_type,
       p.waitresource,
       p.status,
       p.open_tran,
       p.loginame,
       p.hostname,
       p.program_name,
       r.percent_complete,
       r.wait_type,
       r.last_wait_type,
       p.waittime
from sys.dm_exec_requests r
       cross apply sys.dm_exec_sql_text(r.sql_handle) t
inner join sys.sysprocesses p on p.spid = r.session_id 
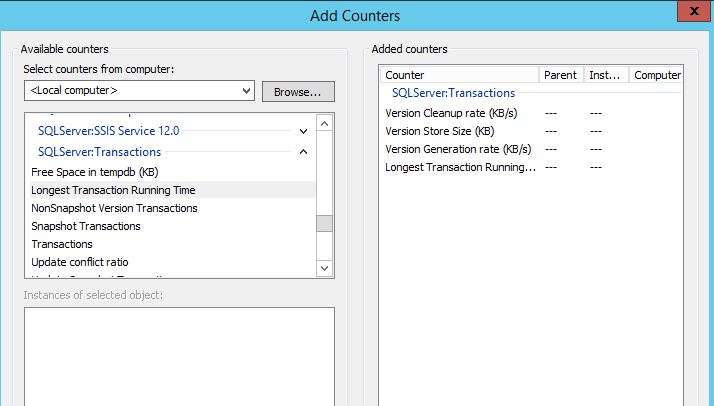
After further investigation, with the help of performance counters, I tracked the below performance counters.
- SQLServer:Transactions\Longest Transaction Running Time – shows the longest transaction that’s currently running
- SQLServer:Transactions\Version Store Size (KB) – shows the current size of all the version stores
- SQLServer:Transactions\Version Cleanup rate (KB/s) – shows the rate of version cleanup in tempdb
- SQLServer:Transactions\Version Generation rate (KB/s) – shows the rate of version generation

The Longest Transaction Running time counter was showing the value ~ 637803. This meant there was an old transaction that was still using the version store. The Version Store Size (KB) was showing ~850 GB and was still growing bigger. The version Generation rate (KB/s) was at 500 KB/s which was an acceptable range. The Version Cleanup rate (KB/s) was zero which indicated there was no cleanup happening on version store.
I then tried mapping the time of the oldest transaction that was using version store using the below query:
select dateadd(ss, -637803,getdate())

I then mapped the above time with last_batch in master.sys.sysprocesses table.
select spid,
       login_time,
       last_batch,
       status
from   master.sys.sysprocesses
where last_batch between '2016-09-20 05:44' and '2016-09-20 05:46' 
kill 484
The SPID was in sleeping state and was 7 days old. As soon as I killed the SPID, the version cleanup started and Version store size started to decrease. The session that was in sleeping state was actually blocking the version store from cleaning up.
SELECT GETDATE() AS runtime,
    SUM(user_object_reserved_page_count) * 8 AS usr_obj_kb,
    SUM(internal_object_reserved_page_count) * 8 AS internal_obj_kb,
    SUM(version_store_reserved_page_count) * 8 AS version_store_kb,
    SUM(unallocated_extent_page_count) * 8 AS freespace_kb,
    SUM(mixed_extent_page_count) * 8 AS mixedextent_kb
FROM sys.dm_db_file_space_usage; 
Conclusion
It is good to monitor tempdb growth on AlwaysON secondary server because alwaysOn uses tempdb to store row versions and temporary readonly statistics that are created by optimizer on readonly databases.
The performance counters like Version Store Size (KB), Version Cleanup rate (KB/s), Version Generation rate (KB/s), Longest Transaction Running Time are helpful in troubleshooting version store growth in tempdb. It is also a good practice to kill sessions that are idle for long.
This was one of the interesting issues I faced in the recent past and wanted to share the same with you. Hope my article is helpful.


