Creating tables in Power BI can be useful in some situations. In this article, we will see the two main ways to create our own internal tables in Power BI.
Prerequisites
All we need for this example is the Power BI Desktop edition.
Getting Started
First of all, in Home, select the icon Enter data.

This will show a table to add columns and data.
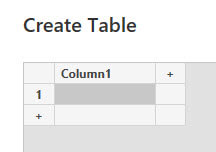
Use the + symbols to add columns and rows.
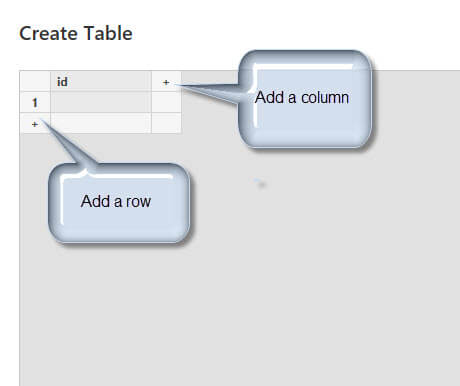
We can add some data to the table just by typing in the grid.
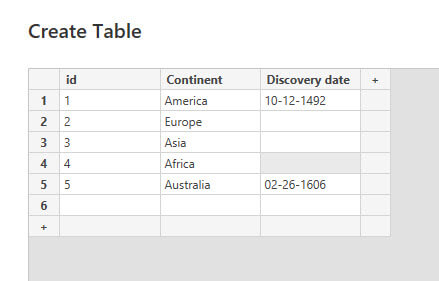
Finally, specify the table name and press Load.

Edit tables in Power BI
In the visualization, you can see the table previously created.
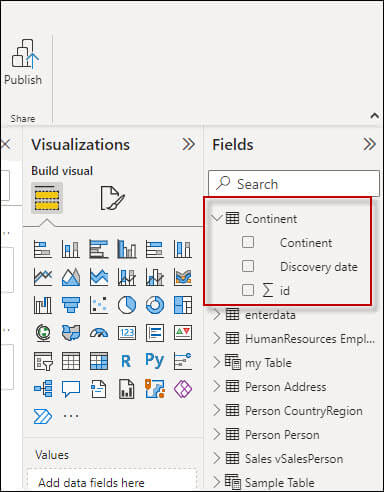
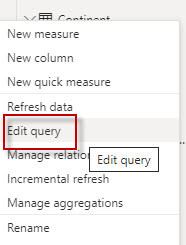
To edit the data, right-click the table and select the Edit query option.
Secondly, in the applied steps on the right Query Settings, under Source, press the gear icon.

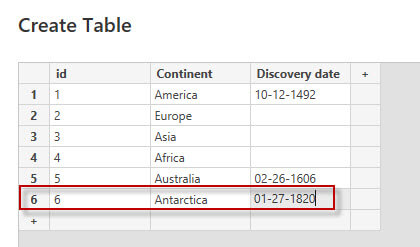
Add or edit the data. You can add columns, rows. In this example, we are adding a row with data.
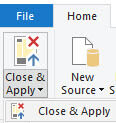
Finally, press the Close & Apply button to apply the changes.
Create Tables in Power BI using the DAX Table Constructor
It is also possible to create a new table using DAX. The DAX table constructor allows creating a table.
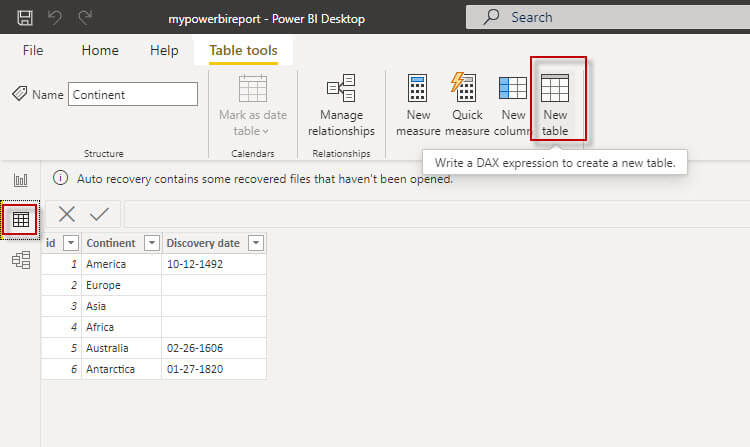
First, go to Table tools and select New table.
Secondly, create a table named Players with the value equal to 1. We use the code below to do this.
Players = {1}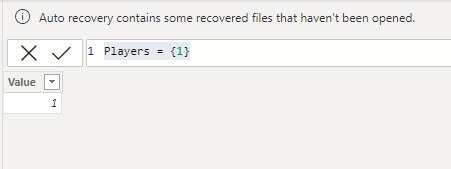
Now, create a table with a column with text, another column with numbers, and the last column with a date. In this example, we will create a row with the first column with the soccer player Messi, the player number equal to 30, and the birthdate equal to June 24, 1982. Here is the code:
Players = {("Messi",30,DATE(1982,06,24))}
Note that to start the table you specify the table name and an equals symbol. We use braces to surround the table data. To start and end a row we use parenthesis. If we need to specify a date, we use the date function.
Here, we will create an example to show 2 rows. The following example will include information for Messi and Mbappé. The syntax will be the following.
Players = {("Messi",30,DATE(1982,06,24)),
("Mbappé",7,DATE(1982,12,20))}
The result displayed will be the following:

In other words, the syntax is like this:
Tablename= {(“stringcolumn1row1”, 3,DATE(1991,11,23)),
(Stringcolumn1row3,4, DATE(1991,11,23))}
For strings characters, we use double quotes. The numbers are written as they are and for dates, we use the date function and provide the year, month, day. To separate rows, we use parenthesis.
Finally, you can double click on the columns and edit the names.

Create Tables in Power BI with Functions
It is possible to have DAX functions in our tables. The following example will use the function now and the function today.
The example provided will create a table named players with two rows. The third column is using functions. The first row is using the now function and the second row is using the today function.
Note that the function now includes the time while the today function doesn’t.
Players = {("Messi",30,now()),
("Mbappé",7,TODAY())}
Conclusion
We show how to create tables in Power BI using the enter data option and then we created a table using DAX expressions. Definitely, using the entered data is easier. The option to edit the data is not easy to find, but once you find it, it is the easier way to edit data.
DAX expressions are a little harder to create and there is no UI for this task. This option is recommended if you love DAX or if you already have the code and you want to just copy and paste the data to generate the information.
In general use tables from the data sources and use these internal tables, especially in demos or to handle data that do not require to be edited often because you are editing the Power BI file. So, use this for proof of concept projects, and demos. It is not recommended for productions. For production use databases or external files.

