In December 2009, SQLServerCentral.com moved its backend SQL Server instance to a two-node cluster hosted by Rackspace. At the time, the new instance ran on node 1 of the cluster in an active/passive configuration. In May 2010, Simple-Talk.com moved its SQL Server instance to node 2 of the same cluster. Now, this active/active two-node cluster hosts the SQLServerCentral.com databases on node 1 and Simple-Talk.com databases on node 2.
Because the clustered servers were hosted outside of the Red Gate offices, the internal IT staff used a VPN connection to monitor and manage them. As you might expect, since the servers weren’t local, and the IT staff was stretched thin (isn’t that always the case?), the cluster wasn’t monitored as closely as it should have been. Sure, SQL Server Agent job e-mail alerts were configured, letting the IT staff know if a job had failed, but all other monitoring was manual, and only occurred on an occasional basis.
This changed in November 2010 when Red Gate Software announced the introduction of SQL Monitor 2.0. It was installed on both nodes of the cluster, making it much easier for the Red Gate IT staff to see what was going on, because they could monitor them directly from a web browser. In fact, anyone interested in seeing the servers’ configuration, the alerts raised by SQL Monitor, or the performance of these two servers, can visit monitor.red-gate.com, where a read-only version of SQL Monitor displays all this information to the public, warts and all.
When SQL Monitor was first installed, a decision was made to let SQL Monitor run on the two SQL Server instances, but for the IT staff not to take any action based on the feedback it provided, critical issues notwithstanding. In other words, we left both instances in their pre-SQL Monitor configuration to demonstrate what SQL Monitor could find out about the servers. If all the issues had been fixed immediately, then there wouldn’t have been much for anyone to see when they looked at the servers using SQL Monitor.
SQL Monitor has run on the two instances for about four months now, and we have decided to take small, incremental steps to implement best practices on the servers, track down problems raised by alerts, and optimize the servers’ performance. While we could do this all at once, we thought it might be an interesting experiment to do it very slowly, at the same time incorporating the feedback of the SQL Server community on what we should do. In other words, anyone from the SQL Server community could use SQL Monitor to check out the servers and suggest configuration changes, how to resolve problems identified by alerts, and how to tune performance.
Here's how we hope the experiment will work. I will act as a moderator, bringing up issues in articles such as this one. You, as part of the SQL Server community, can offer suggestions and advice on how to best deal with that particular issue. To keep this project manageable, each article will focus on a very narrow topic. This means that if you use SQL Monitor to check out the SQLServerCentral and Simple-Talk servers, and notice something that needs to be investigated or changed, you need to wait until we cover that topic to let us know. This week, as a starting point, I want to focus on the property settings displayed in SQL Monitor for each node, instance, and database.
You can give us your feedback here.
I’m starting with such a simple task, because this is what I do when I first check out a SQL Server that I have never seen before. Often, just by checking simple properties, you can easily identify problems that should be fixed. Later, once the easy and obvious problems are fixed and out of the way, it is time to dive deeper into the server.
What I would like you to do is go to monitor.red-gate.com and drill down into each node, instance, and database, looking at the property information displayed. Look for anything out of the ordinary that you think should be changed. You will probably see a lot of other interesting things as you take a look around, but for now, let’s focus on node, instance, and database properties.
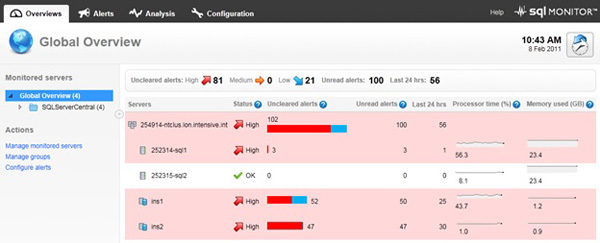
Here’s what I suggest you do. When you first go to the website, you will see a screen that looks similar to this:

Figure 1: the SQL Monitor Global Overview screen.
The Global Overview screen shows you the name of the cluster (254914-ntclus.Ion.intensive.int). Below that you will see the two physical cluster nodes (252314-sql1 and 252315-sql2) and the two SQL Server instances (ins1 and ins2).
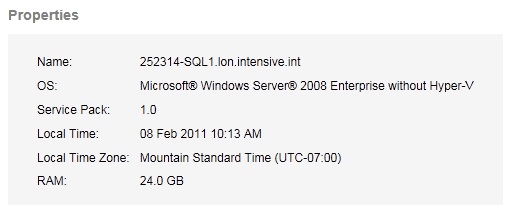
To view the properties of a node, click on the node, and the node overview screen is displayed. Now scroll down to the “Properties” section and look for anything out of the ordinary. Do this for both nodes.

Figure 2: the node “Properties” screen.
To view the properties of an instance, click on the instance, and the instance overview screen is displayed. Now scroll down to the “Server properties” section and look for anything interesting. Do this for both instances.

Figure 3: the instance “Properties” screen.
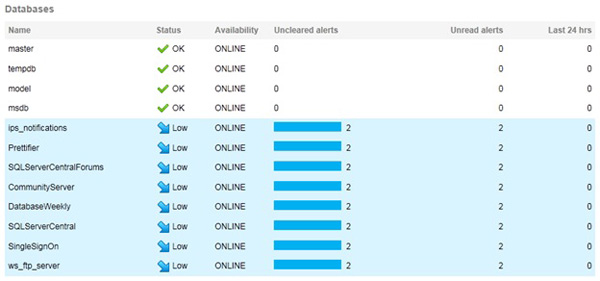
While you are at the instance overview screen, you will notice that all of the databases on the instance are displayed.

Figure 4: a list of all the databases on a single instance.
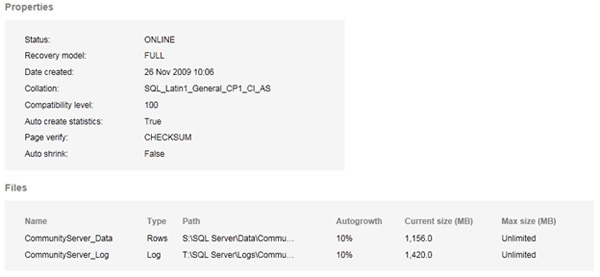
To view the properties of a database, click on a database, and the database overview screen is displayed. Now scroll down to view both the “Properties” and the “Files”, and look for anything you think looks out of the ordinary and should potentially be changed. Do this for each of the databases.

Figure 5: check out each database’s Properties and Files configuration information.
Make your comments using the link at the bottom of this article, which will direct you to the forums. Steve Jones, Grant Fritchey, Simon Lye (our in-house IT DBA), and myself will offer our own comments on your feedback. Once we get the feedback, I will summarize and compile a follow-up article, along with an explanation of what feedback we (Simon, Steve, Grant, and myself) decided to take and not to take. Once these two articles are complete, I’ll write the next part of the series and introduce a new topic.
To summarize, this clinic focuses strictly on the configuration information displayed by SQL Monitor, so save your other comments for future articles. When you post your suggestions, please be as specific as you can. Tell us where you think you see a problem, describe the problem, and explain what should be changed and why.
So, if you’re up to the challenge, check out monitor.red-gate.com and offer us your advice in the discussion for this article.

