Introduction
In Part 1 of the series, Introduction to Profiler, I introduced the basics of using SQL Server Profiler. In this article we will continue by looking at how to save a trace definition as a template and how and why to save trace data collected. This article will assume that you either have experience with Profiler or read the previous article.
Creating a Custom Trace Template
Let's look at a few common questions about trace templates.
Why would I create my own template?
You may have a trace that you want to run on a regular basis to monitor activity or performance on a specific database or by a specific application. It may be that you have a trace definition you would like to share with the other DBA's or developers in your shop, so that you know that you are all looking at the same data. In any scenario where you know you will be re-using a trace definition in Profiler, creating a template is the way to go.
How do I create a my own template?
There are two ways to define a template. The first way is to open Profiler and go to File -> Templates -> New Template or Edit Template (Figure 1).
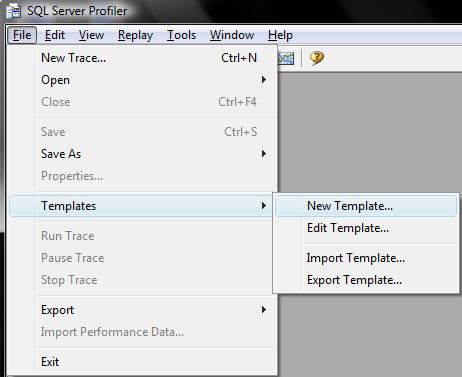
Figure 1
If you select New Template you will be presented with the Trace Template Properties dialogue (Figure 2). Here you can select the version of SQL Server you want the template to target, name the template, choose to base the template on an existing template, and set the template to be the default template (will be the selected template when you open Profiler).
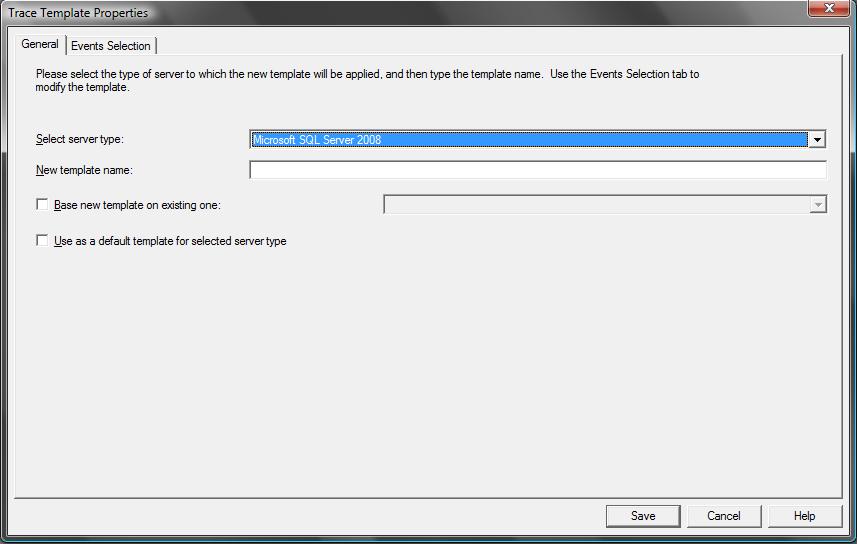
Figure 2
Next you will go to the familiar Events Selection tab to define the trace template. The only difference between the Events Selection tab here and when preparing to run a trace is that the default behavior is to show All Events and All Columns (Figure 3).
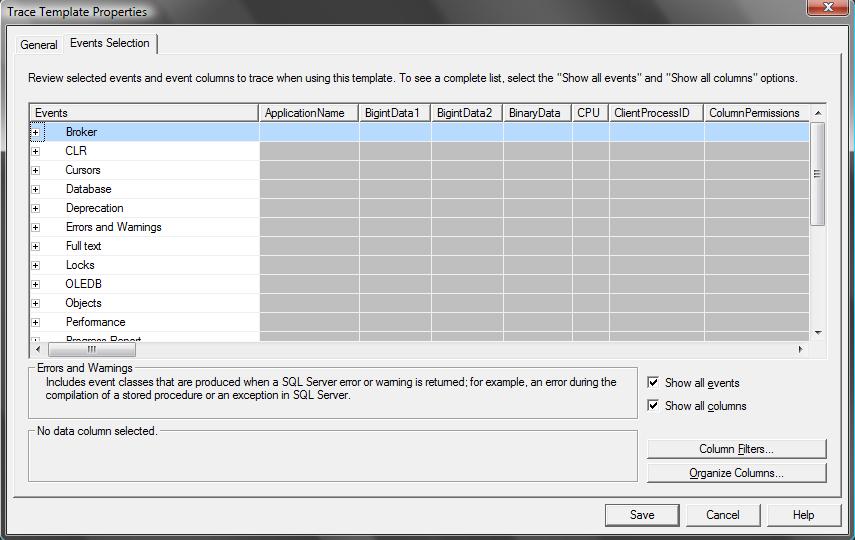
Figure 3 (not based on an existing template)
If you are basing your template on an existing template, you will have the events and columns included in that template already selected. Once you have named and defined your template, click the Save button and you template is complete. It will now be available in the “Use the Template” drop-down box within Profiler (Figure 4) with “(user)” appended to the template name.

Figure 4
The second method is to create a template from a trace you have already created and run. You can save the definition as a template while it is running or after you have stopped or paused it. You save the definition by going to File -> Save As -> Trace Template (Figure 5).
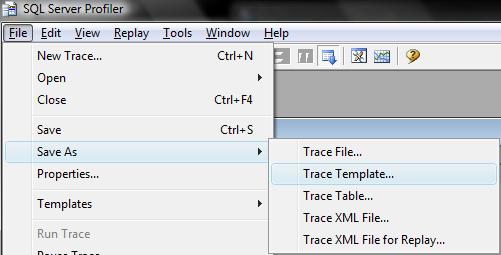
Figure 5
You will then be able to name the template. You can only save it as a template designed for the Database Engine you are tracing against (Figure 6).

Figure 6
One last thing you need to know about creating templates is that, by default, the templates are saved to the currently logged in user's directory, thus they are only available when logged in as that user. On Vista this is C:\Users\[UserName]\AppData\Roaming\Microsoft\SQL Profiler\[Version #]\Templates\Microsoft SQL Server\[Version # Saved As], and on XP or Windows Server 2003 this would be C:\Documents and Settings\[UserName\Application Data\Microsoft\SQL Profiler\[Version #]\Templates\Microsoft SQL Server\[Version #]"
To make templates available to all users, copy them to SQL Server installation directory\[Version #]\Tools\Profiler\Templates\Microsoft SQL Server or Analysis Services\[Version #]\. Because the templates are in the default template directory they will longer show as user templates, so be sure that you have named them so that is obvious that they are User Defined Templates. These templates will only show up for the version that matches the version directory you have saved them in. So if you move it to 100 (2008) it will only be available when tracing a 2008 server, etc...
Saving Trace Data
Why save collected trace data?
You might want to save trace data so that you can manipulate it using T-SQL or to be able to do performance comparisons between original code performance and modified code performance.
How do I save collected trace data?
As noted in Part 1, you do have the option of saving trace data to a table or file concurrently while Profiler is displaying the data, although neither of these options are recommended due to performance considerations. You can save the collected trace data by going to File -> Save which will save the trace data as a Trace File, or File -> Save As and selecting one of the following four options (Figure 7):
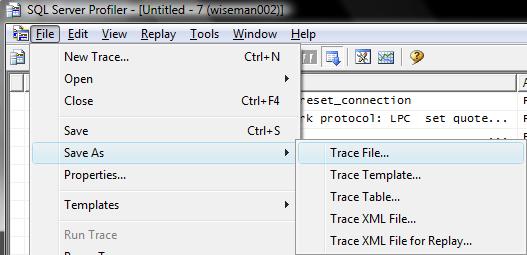
Figure 7
1. Trace File - the default file type used when selecting Save. A binary file readable by Profiler or the system function fn_trace_gettable.
2. Trace Table - a table in SQL Server. You will be prompted to connect to a server (Figure 8) and select a database and table to save to (Figure 9).
3. Trace Xml File
4. Trace XML File for Replay
Saving to any of the file types will ask you for a location and file name just like any other application.
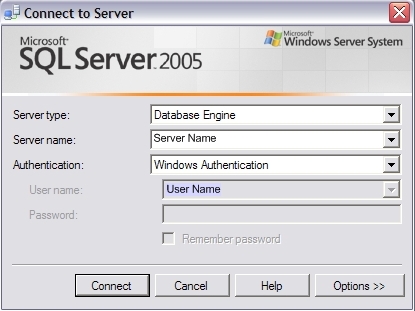
Figure 8
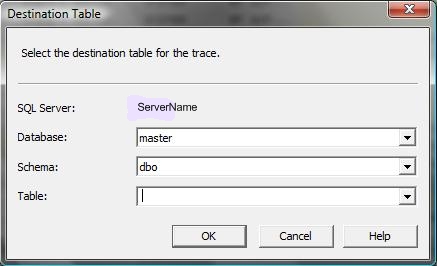
Figure 9
Once you have saved trace data you can re-open it later in Profiler or the Trace File can be queried using fn_trace_gettable. The XML Files can be queried using your favorite XQuery tool, and the table can be queried using T-SQL.
Conclusion
You have many options for creating templates and saving trace data. Coming up next we will look at replaying a saved trace.
Resources
Microsoft SQL Server 2005 Unleashed
Inside Microsoft® SQL Server(TM) 2005: Query Tuning and Optimization
SQL Server 2005 Books On Line
http://www.databasejournal.com/features/mssql/article.php/3750161
http://www.databasejournal.com/features/mssql/article.php/3755911


