After a recent performance related post at http://www.sqlservercentral.com/Forums/Topic708345-360-1.aspx#bm708809, the SSC user Mohit posted some great references to Microsoft supplied performance related queries and reports for SQL Server 2005. I decided to install the Performance Dashboard and document my results as I went. This article is a detailed step by step intended for beginner level report writers or DBAs that want to have a better view into the performance of their servers. It’s also an excellent example of a well designed dashboard.
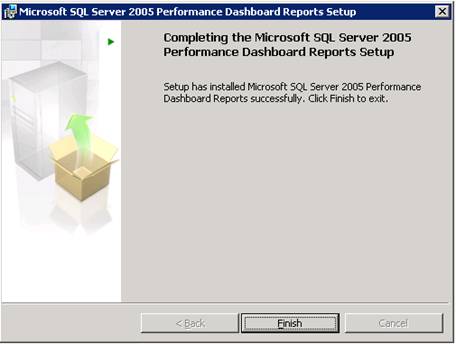
Step 1) Download and Install the Performance Dashboard
Download from http://www.microsoft.com/downloads/details.aspx?familyid=1d3a4a0d-7e0c-4730-8204-e419218c1efc&displaylang=en and kick off the install:

Accept the license agreement.
Step 2) Run The Setup.sql File
By default, the installation places the files at C:\Program Files\Microsoft SQL Server\90\Tools\PerformanceDashboard. You will find setup.sql in this folder. This script will have to be run on any server instance that you want to monitor. The script creates the following:
- MS_PerfDashboard database schema,
- Functions:
- MS_PerfDashboard.fn_WaitTypeCategory
- MS_PerfDashboard.fn_QueryTextFromHandle
- MS_PerfDashboard.fn_hexstrtovarbin
- Stored Procedures:
- MS_PerfDashboard.usp_CheckDependencies
- MS_PerfDashboard.usp_Main_GetCPUHistory
- MS_PerfDashboard.usp_Main_GetMiscInfo
- MS_PerfDashboard.usp_Main_GetSessionInfo
- MS_PerfDashboard.usp_Main_GetRequestInfo
- MS_PerfDashboard.usp_Main_GetRequestWaits
- MS_PerfDashboard.usp_GetPageDetails
- MS_PerfDashboard.usp_GetPlanGuideDetails
- MS_PerfDashboard.usp_TransformShowplanXMLToTable
It also grants execute permissions for the public role on each of the above. The setup.sql script goes on to create 41 more functions that the above functions and stored procedures reference. Public permission is not granted to these last 41 functions. As the help file states “The dashboard does not create a database or tables or store any trending data over time. It relies solely on the information made available in the SQL Server 2005 dynamic management views (DMVs). “ The script should complete in a matter of seconds.
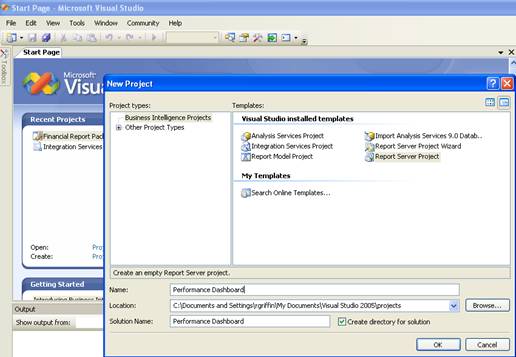
Step 3) Launch Visual Studio and create a new project file to add the reports to.
I’ll call mine “Performance Dashboard.”
After you’ve created your project file, right click the reports folder in solution explorer and choose Add Existing Item:

Browse to C:\Program Files\Microsoft SQL Server\90\Tools\PerformanceDashboard (default location), highlight all the files and click add:
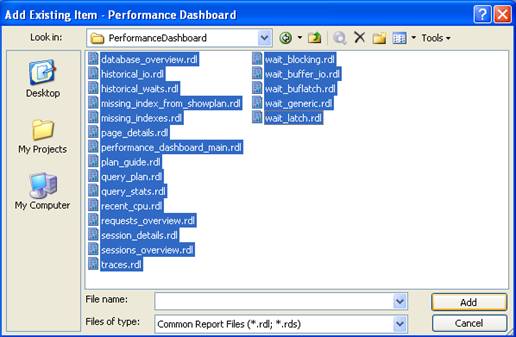
This places all of the rdl files into your project’s solution explorer.
Step 3) Create a Shared Datasource.
Right click the shared datasources folder in the solution explorer window and choose add new datasource:
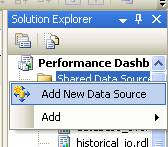
Keep the default datasource1 name and edit the connection string choosing your server instance name and msdb as the database:
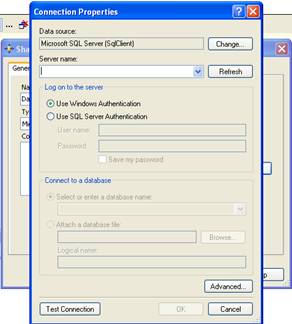
Click OK on this screen and the shared datasource screen to complete the datasource1 setup.
Step 4) Run Some Reports.
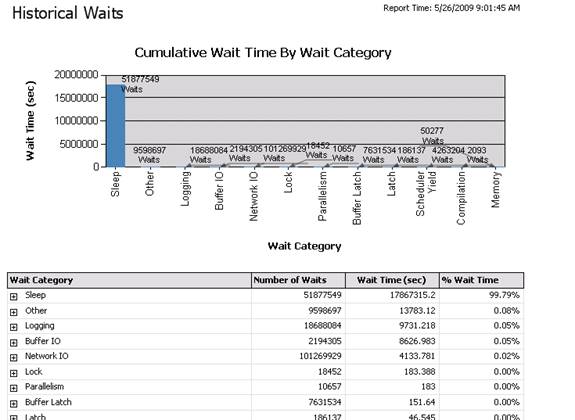
At this point you must be ready to run some reports. If you do like I did in BIDS, you’ll open the ‘wait_latch’ report at the top of the list, click the ‘Preview Tab’ and you’ll get the following error: “The version_string parameter is missing a value.” This is a dashboard, so the reports are all designed to be run from the main dashboard report called “Performance Dashboard Main.” So go open this one first and the appropriate parameters will be passed from here to all the referenced reports as you click through to them. Here are a couple of screen shots, performance dashboard main and the historical waits report:
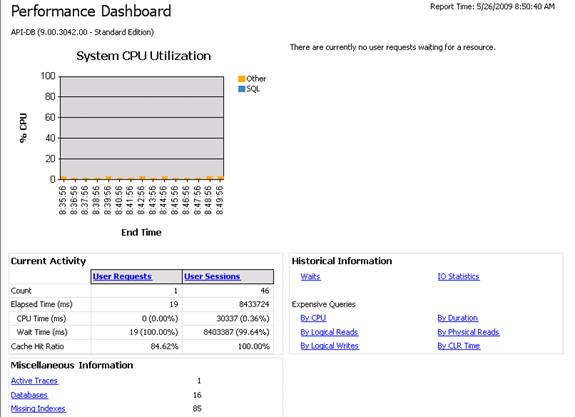
From this screen click on the “Waits” link in the “Historical Information” box and you will be taken to the “Historical Waits” report:
Using this method to set up your Performance Dashboard reports allows you the option of scheduling your reports to email you using Reporting Services subscriptions. I will be exploring that option myself in the future. I want to use this as a historical snapshot of my databases providing a performance base line that I can go back and reference should the need arise. If you are in a hurry and just want to see the reports without scheduling them you can use Brad McGehee’s method of running these reports (see http://www.sql-server-performance.com/articles/per/bm_performance_dashboard_2005_p1.aspx )
Performance Dashboard Main displays some gorgeous information from the Dynamic Management Views. Exploring and understanding this data is another topic for another day dealing with performance tuning. However, using these reports gives you a huge head start on understanding any performance related issues you may be having. It’s a great idea to monitor these at different times throughout the day. This will help you get a feel for how your server runs under normal circumstances so that when the day comes when you server is not performing well; you will be able to see very quickly what is out of order.
References:
http://www.learnsqlserver.com/Blogs/SqlServerBlog/2007/03/sql-server-2005-performance-dashboards.html - “The version_string parameter is missing a value.”
http://www.sqlservercentral.com/Forums/Topic708345-360-1.aspx#bm708809
http://blogs.msdn.com/bartd/archive/2007/07/19/are-you-using-sql-s-missing-index-dmvs.aspx
http://blogs.msdn.com/psssql/archive/2007/03/30/sql-server-2005-performance-dashboard-reports.aspx
Keywords: DMVs, Dashboards, Sql Server Reporting Services, Dynamic Management Views, Performance Tuning.


