Introduction
SQL diagnostic manager (SQLdm) is an fantastic tool from Idera for monitoring SQL Server performance and diagnosing server and database problems. Think of SQLdm as an extra DBA who doesn’t have to go to meetings and never takes a day off while it watches your servers and warns you about real and potential problems. Unlike many vendors which sell monitoring software for SQL Server, Idera only sells products for SQL Server.
Environment
I installed SQLdm on a Windows 2000 Server with SP4. This particular server does have SQL Server 2000 with SP3 installed, but it is not used for any production databases. The documentation warns against installing the software on a server that will be monitored because of an impact on performance. It does not need SQL Server on the same computer and the documentation actually suggests using a dedicated box if monitoring over 15 servers. SQLdm runs as service and can be installed on the following operating systems:
- Windows XP Professional
- Windows 2000 Server
- Windows 2000 Professional
- Windows 2003 Server
SQLdm can be used to monitor SQL Server 7 with at least SP3 and any version of SQL 2000. I used it to monitor one SQL 7 instance and nine SQL 2000 instances. Nothing gets installed on the SQL Servers themselves. The account running the service collects the information from the SQL Servers through the network. I set up a special domain account to run the service and added the account to the sysadmin server role on each instance. It is possible to use a SQL Server account to collect the data. In that case, the service account does not need any rights on the SQL Server.
Installation
You can download a 30 day trial version of SQLdm from http://www.idera.com that can be used to monitor up to 15 SQL Server instances. The installation process is simple. You’ll need to accept the license agreement, supply or accept the destination folder and provide a user account to run the service. The product documentation also mentions that you must allow the Cathie Character Microsoft Agent to be installed. The character is used for Interactive Tours of the product.
The installation process sets up the service and installs the user interface on the same computer. By default, the data recorded about the SQL Servers is saved in “alert log” files in the installation folder. This setting can be changed after installation of the product to another folder or to a network share.
To run the current version of the user interface you must log into or remote control the computer where the software is installed. When ordering the product, you can supply the names of the DBAs’ workstations and install it on those workstations as well. This might be a good solution if each DBA is only responsible for certain servers. The alert logs can be configured to write to the same or separate locations. Be sure to review and understand the options available and how to configure them before setting this up. A warning in the documentation states that setting up multiple computers using a shared alert log must be configured before any important data exists in the log. The last alert log configured will overwrite the previously logged data.
In my environment, I just installed SQLdm on a server and ran it remotely using Terminal Services when I wanted to use the program. In addition, a read-only view of the logged information is available via HTML pages. Idera also promises to provide a full-featured web interface soon which will eliminate the need to remote control the server.
The best part of the installation process is that the product is preconfigured to begin collecting data as soon as it is installed and pointed to the servers. You will eventually want to set up alerts to your pager or e-mail and tweak the settings, but SQLdm is ready to work immediately after installation.
Using SQL diagnostic manager
The SQLdm program is divided into three panes: the server navigation tree on the left, the Server List on the upper right and the To Do list on the bottom of the screen as shown in Figure 1.
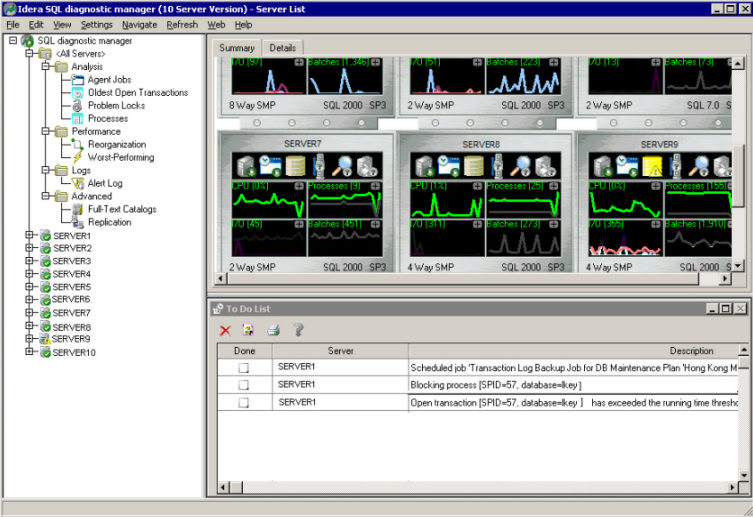
Figure 1
The Server List is a graphical overview of each server that shows the status of the server and databases at a glance. As you mouse over graphs and icons, tool tips pop up with explanations and current values. Double-click each item to bring up other screens showing more details. Notice that Server9 in Figure 1 above has a problem with a database. When I double-click the database icon, another screen pops up with more information as shown in Figure 2.
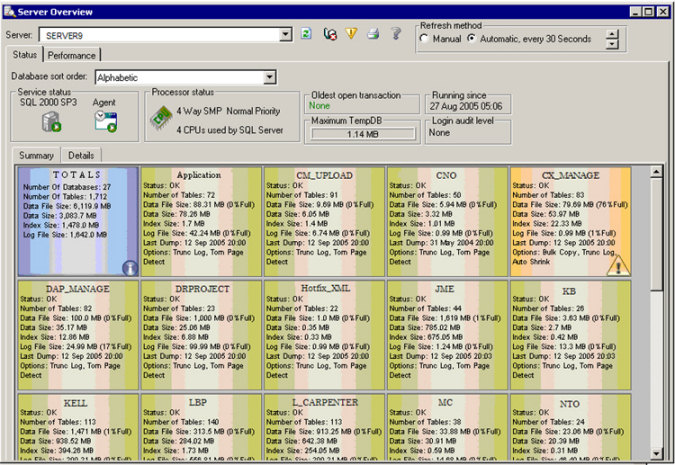
Figure 2
The problem database, one I had previously moved from an MSDE installation, is shown on the screen in pink with a yellow caution triangle. Holding the cursor over the summary shows me the problem in a tool tip: “Warning – Database too full". I can double-click again to drill down for even more information. To solve this I can add additional space to the database during off hours. I also notice that the Auto Shrink property is turned on. I’m sure this property came over when I moved the database from the MSDE, so I’ll turn that off as well.
The To Do List at the bottom of the screen (see Figure 1 above) shows a list of problems that SQLdm has found. You can type in a comment, mark the issue done or delete the item. You can double-click each item to bring up a dialog box with more information. Sometimes you are provided a way to solve the problem at the same time. If you double-click a message about the reorganization percentage of tables, a dialog box listing the percentages and a way to reindex the tables pops up as in Figure 3.
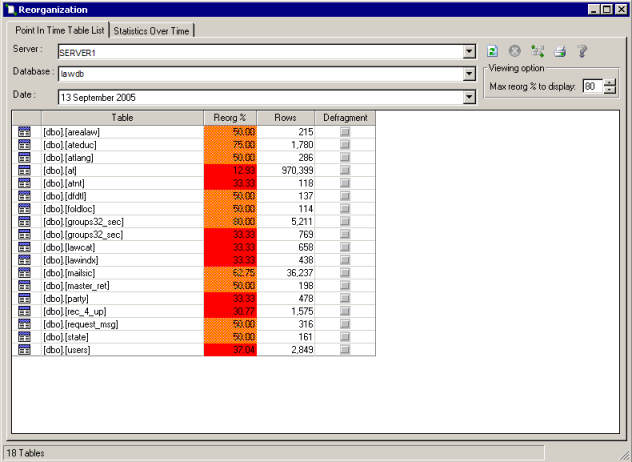
Figure 3
Right after I installed SQLdm and configured it to watch a few servers, the To Do List warned me that the operating system of one of my servers did not have enough memory. The server was scheduled for a reboot that weekend. I went ahead and decreased the SQL Server Max Memory setting before the reboot, and the problem was solved.
The navigation tree allows me to view information about a particular server or about all servers. I am still learning about the vast amount of information available. For example there is an item under Performance called “Worst-Performing”. This feature shows the worst-performing stored procedures and statements for a given time period. You can also set up filters to eliminate or include data according to your environment for this feature as well as many of the features.
Click on Overview under the server name to see performance data in a graphical format as shown in Figure 4.
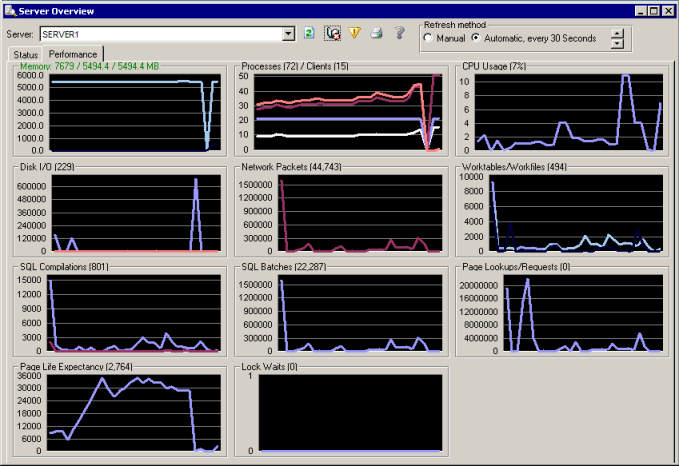
Figure 4
There is a lot of information and it might take a while to explore it all. Some, but not all, of the dialogs available are listed in the Navigate menu:
- Agent jobs
- Alert log
- Full-text catalogs
- Oldest open transactions
- Problem locks
- Processes
- Reorganization
- Replication
- Worst-performing
Once you are familiar with the product, it’s time to configure it for your environment. In the navigation tree in Configure Destination under Alerts you can configure how alerts will be delivered or saved. For those of you who are not fans of SQL Mail, you’ll be happy to learn that it uses SMTP mail instead. The following choices are available:
- Beep
- Windows Application Log
- Windows Message
- ODBC
- External Program
Each type of warning can be delivered by any or all of the possible delivery modes. You can tweak the thresholds and enable or disable the alerts. Setting changes can be applied to some or all of the servers at once. Figure 5 shows some of the configuration options.
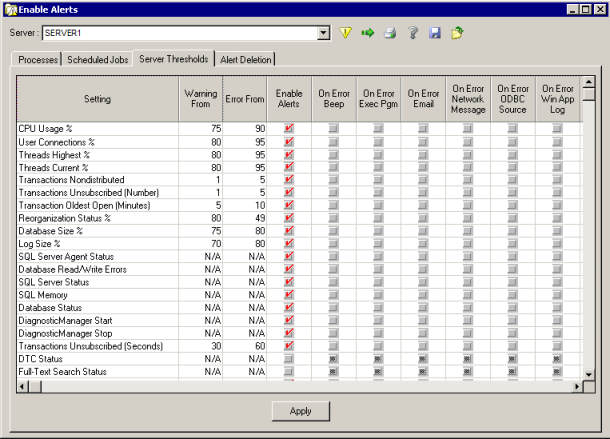
Figure 5
Figure 6 shows one of the read-only web pages available. As mentioned previously, Idera is working on a full-featured web client. One of my favorite things about SQLdm is that it gives you explanations as Figure 6 demonstrates. The documentation with the product is also very helpful with information about why you might want to do something not just how to do it. It is available as context sensitive help or you can download the entire User Guide in PDF format from Idera’s website.
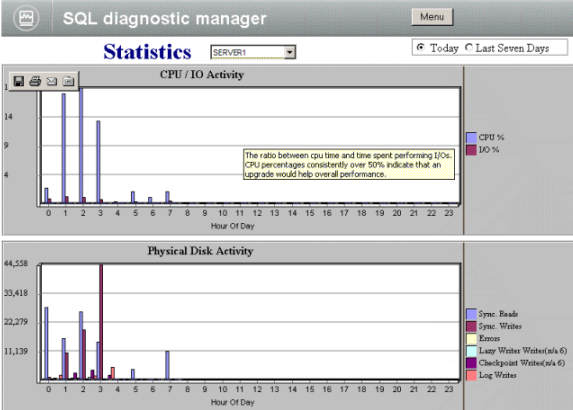
Figure 6
Support
Many support options are available to the customer. You can log a request or question via their website, call or email them or chat with a live service representative. A searchable knowledge base is also available on the website. I requested help from them twice and received an answer back quickly both times.
Update
Editor's Updated: Idera has updated this product with a web console for this product. The description follows:
Idera's SQL diagnostic manager (SQLdm) Web Console is a read-only, Web-based user interface that provides instant, real-time information about your SQL Server environment. Whether you manage five or five hundred servers, whether you are at the office, at home, or at your local Internet café, the Web Console allows you to monitor SQL Server performance and obtain deep diagnostics for troubleshooting and rapid problem resolution.
More information is available at: http://www.idera.com/Products/SQLdm/Console.aspx.
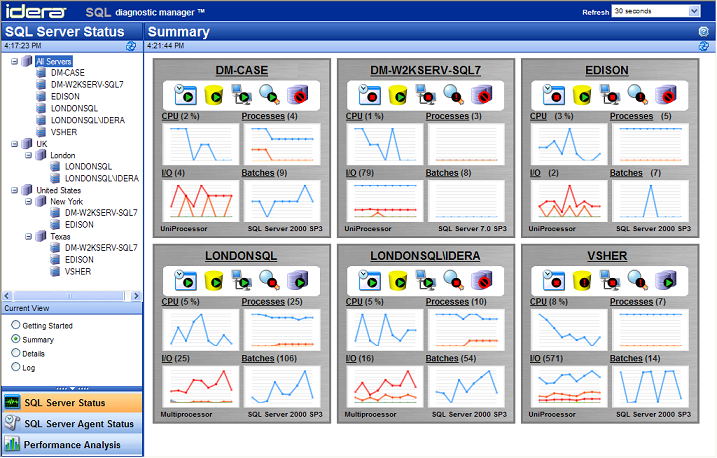
SQL diagnostic manager (SQLdm) SQL Server Status Summary, shown above, allows you to get the status of monitored SQL Servers at a glance. For each monitored SQL Server, this view provides a graphical summary of its status, including the database and agent health. You can quickly and easily scan each server graphic for current issues.
Conclusions
Idera’s SQL diagnostic manager is a fantastic product. It can save you time and enable you to accomplish more by pinpointing the issues and helping you solve them. It’s impossible to cover all the great features in a review article, so I suggest that you contact Idera for a demo.
Ratings
I will rate each of the following using a scale from 1 to 5. 5 being the best
and 1 being the worst. Comments are in the last column.
| Ease of Use | 4 | It is easy to use, but I'll be happier once the new web client is available. |
| Feature Set | 5 | An extensive feature set for identifying bottlenecks and problems and monitoring performance. |
| Value | 5 | Very reasonable price to pay for the rich functionality. |
| Technical Support | 5 | Many support options available and quick response time. |
| Lack of Bugs | 5 | No bugs found. |
| Documentation | 5 | The User Guide has explanations about performance counters and database maintenance, not just how to use the product. |
| Performance | 4 | No noticeable impact on my servers. Be sure to read documentation for cautions about some installation scenarios. |
| Installation | 5 | Easy to install and starts to work with very little configuration. Once you are familiar with the product, you can tweak the settings. |
| Learning Curve | 3 | I am spending quite a bit of time with the User Guide, and I'm still discovering new features. |
| Overall | 4.5 | I think this is a great product that will help me be more proactive. |
Product Information
Web Site: http://www.idera.com/Products/SQLdm/
Developer: Idera
Pricing:
Single Machine - US$995

