Sneak Preview: Start to Finish Guide to SQL Server Performance Monitoring
of the nice things about a book store is the ability to go, grab a book, and
look through it. Often before I purchase a book, I'll do just that. If I want to
order a book on-line because of a deal and I can subdue that "must have it
NOW" impulse in myself, I'll still make a drive down to my favorite
bookstores and see if I can find it on the shelf. This is much more difficult
with an e-Book.
To try and give more of that "browse the bookshelf"
experience, I've prepared some excerpts of the e-Book Start to Finish Guide
to SQL Server Performance Monitoring. I've made selections of several key
sections of the book. Here are the excerpts I've chosen:
If you are interested in purchasing the e-Book through SQL Server Central,
page for SQLServerCentral.com customers.
Excerpt 1: From Performance Counters
SQL Server Counters
SQL Server Counters Quick Reference | |
SQLServer:Buffer Manager\Buffer Cache Hit Ratio
| % of data pages found in memory |
SQLServer:Cache Manager\Cache Hit Ratio
| Ratio of execution cache hits versus total number of lookups |
SQLServer:General Statistics\User Connections
| Number of currently connected users |
SQLServer:Latches\Average Latch Wait Time (ms)
| Average time to obtain a latch |
SQLServer:Latches\Latch Waits/sec | Number of latches established per second |
SQLServer:Locks\Average Wait Time (ms) | Average time to obtain a lock |
SQLServer:Locks\Lock Timeouts/sec | Average # of lock attempts expiring without a lock being established |
SQLServer:Locks\Number of Deadlocks/sec | Average # of deadlocks occurring per second |
SQLServer:Memory Manager/Total Server Memory | Amount of memory being utilized by SQL Server |
SQLServer:SQL Statistics\SQL Re-Compilations/sec | Average # of execution plans being recompiled per second |
Just as the hardware has counters, so does SQL
Server. There are specific counters
we use in conjunction with the hardware counters to determine how well SQL
Server is performing on a given system. We
also have to realize that the way SQL Server operates is fundamentally different
from a file server, web server, or domain controller. So there may be times when we’ll see processor utilization
near 100 % for a given time period (for instance, a particularly complex DTS
package which does our data warehousing) and we have to take those things into
account.
SQLServer:Buffer Manager\Buffer Cache Hit Ratio
Threshold: < 90 %
The Buffer Cache Hit Ratio represents the percentage of data pages
found in memory. When SQL Server
finds the data in memory, it doesn’t have
to go to the physical disk to retrieve the data.
Since retrieving data from a hard disk is significantly slower than
retrieving memory from physical memory, we want to pull data from memory as
often as possible. As a result,
we’re looking for as close to 100% for a Buffer Cache Hit Ratio as possible.
The threshold is therefore understandably high.
If we start dipping below 90 %, it’s time to consider extra RAM.
Others feel in an OLTP environment this number should be greater than
95%. Still others are looking for
98%. I like to consider 90% a
minimum.
SQLServer:Cache Manager\Cache Hit Ratio
Threshold: Varies (<90% for in-house developed applications)
This corresponds to the ratio between cache hits of execution plans versus
lookups. We want this number as
close to 100% regardless of the instance, but I’ve not seen any hard and fast numbers for a threshold. For applications we have built the data access layer for, we look for
numbers around 90 %. Often, for
third-party applications there is little we can do, as the data access layer is
hard-coded/not subject to modification.
There are two reasons why the number could be low:
- An execution plan doesn’t exist
- The execution plan couldn’t be located on the first pass
The first possibility can occur if we’re short on memory or if our stored
procedures, triggers, and ad hoc queries require recompiling, making an
execution plan of little use. The
second tends to occur because either we’ve not specified an owner and the user
isn’t dbo or we’ve used the sp_ prefix and the stored procedure is in a user
database. I’ll discuss more on
these issues later.
Excerpt2: A Real World Example
In The Real World
A
real-world example I can cite occurred towards the end of a business day (as
always)and we were all looking to get home.
An application group was working late on changes to a system written
within the organization. A
development server hosting SQL Server suddenly became very slow.
Queries normally running in less than a second were taking a minute or
more. Immediately the DBA team
popped up System Monitor and took a look at the processor and memory counters as
well as the ones in SQL Server for locks and user connections.
What we saw was the number of user connections was average for the
development server (about 15-17) but lock waits were higher than normal.
We also saw the memory counters showed no problems but processor
utilization was near 100 %.
Since
the development server hosted a couple of other third-party applications that
provided additional functionality to the application, we wondered if one of them
was the culprit. Keep in mind that
during this time the application team was screaming for the heads of the DBAs
for allowing SQL Server to get in such bad shape. We took a look at the cache hit ratio and the buffer cache
hit ratio. Both were normal.
We
tried to get to SQL Server using Query Analyzer and making the connection took
considerably longer than normal. Executing
a the sp_who2 system stored procedure
to see what activity was going on in SQL Server, we saw there was very little…
though it took nearly two minutes for the system stored procedure to return this
information. At this point, we had
enough evidence to say it most likely was not SQL Server.
But we needed one more counter to confirm what we believed.
A counter object we haven’t talked about is Process.
This object has an instance for every process running on the system.
We added the instance for sqlservr (the name of the process for SQL
Server) for % processor utilization and saw it was low (less than 10 %). This
vindicated the DBA team.
We
were off the hook, but the problem still existed, so we continued to investigate
by checking out all the processes. Sure
enough, one of the third-party applications was continually registering > 95
%. We used a tool to kill the
process remotely and watched the processor utilization for the entire system
drop immediately. Suddenly the
queries started resolving in the expected times.
Problem solved! After a
quick write-up, we headed home.
Excerpt 3: Using Profiler to Find Deadlocks and LockTimeouts
Locks
Acquiring and releasing locks is a typical part of
any multi-user database system and SQL Server is no exception.
SQL Server allows us to track locks being acquired and released in
events, but in a SQL Server installation with any kind of concurrent usage,
these events will occur frequent enough to be of relatively little value.
There are other events, however, that are of great use.
- Lock:Deadlock
- Lock:Deadlock Chain
- Lock:Timeout
The first two, Lock:Deadlock and Lock:Deadlock
Chain, are very useful if we’re trying to track down what statements are
causing deadlocking issues. While
it is well-understood database tables and views should always be accessed in the
same order, in larger environments this rule can be violated quite easily when
multiple developers are working to create a usable system.
By turning on these events, we can report these conflicts and get the
information back to our development teams.
To create a deadlock event on your own, open two
connections in Query Analyzer to a server.
For our example, we’ll use the Northwind database.
In one connection, we’ll enter the following code:
-- BEGIN TRAN
/*
UPDATE Customers
SET CompanyName = 'Doe, Inc'
*/
-- SELECT * FROM Employees
-- ROLLBACK TRAN
In the other connection, we’ll place the following code:
-- BEGIN TRAN
/*
UPDATE Employees
SET LastName = 'Doe'
*/
-- SELECT * FROM Customers
-- ROLLBACK TRAN
The idea here is we’re going to have one connection
create an exclusive table lock on the Customers table. The other connection will create an exclusive table lock on
the Employees table. Then the first
connection will try and select from the Employees table.
Since the second connection has an exclusive table lock and the
transaction isn’t committed, it’ll be blocked.
Then we’ll have the second connection try and select from the Customers
table. It too will get blocked and
SQL Server will realize that we’ve run into a deadlock situation.
Let’s step through each step. First
we highlight and execute just BEGIN TRAN for both connections, as in figure 54.
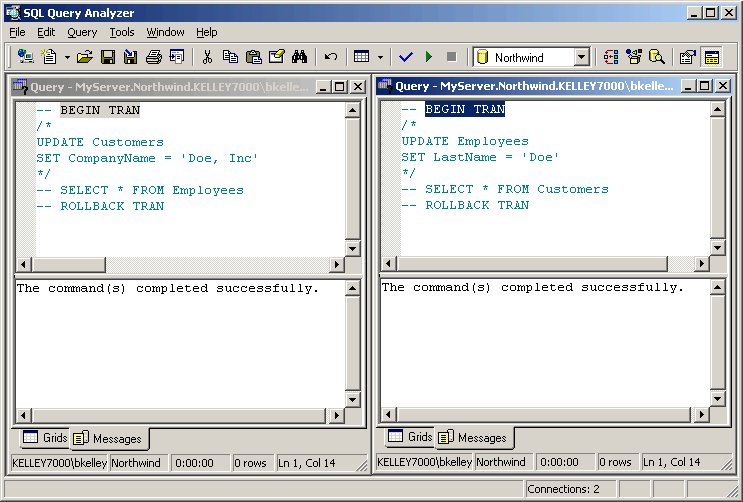
Figure 54: Executing BEGIN TRAN on Both
Connections
Next we’ll execute both UPDATE statements to create
the exclusive table locks (Figure 55).
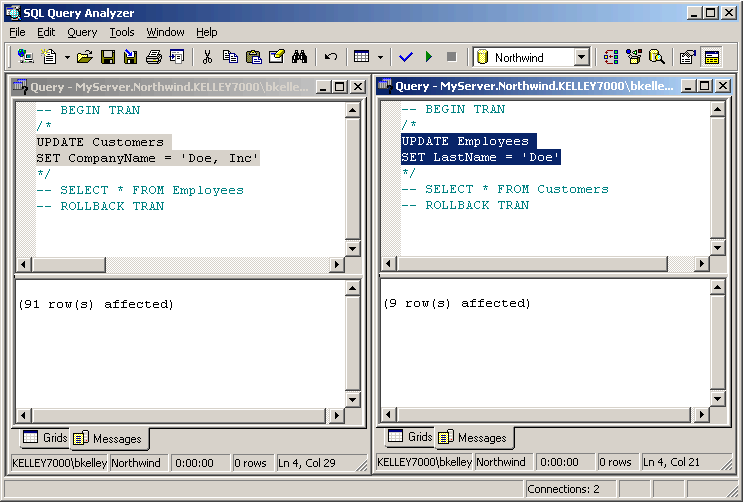
Figure 55: Update Statements Forcing
Table Locks
The final step to is to execute the SELECT
statements. This will force the
deadlock and one of the connections will have its operation terminated and the
transaction will automatically rolled back (Figure 56).
The other connection, since the table lock is removed, will be able to
complete execution of the SELECT statement.
As a matter of cleanup, the ROLLBACK TRAN statement will need to be
executed on the connection (the first connection in figure 56) whose SELECT
statement completed.
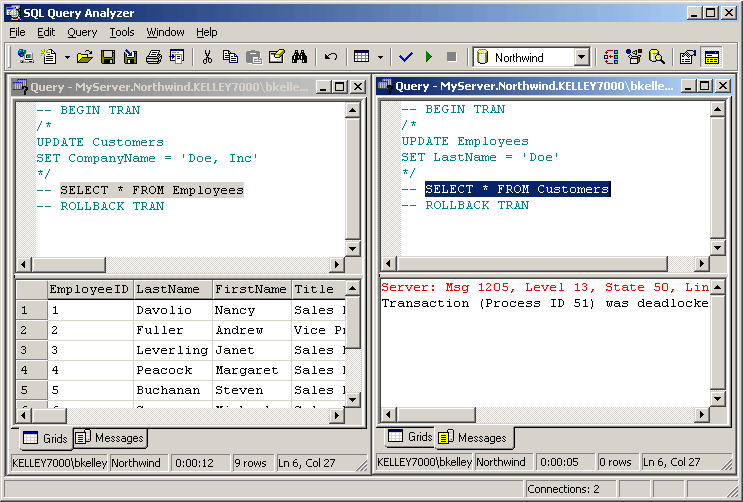
Figure 56: SELECT Statements forcing the
Deadlock
We’ll also see
the Lock:Deadlock and Lock:Deadlock Chain events occur in our
Profiler trace in Figure 57. In
this particular example, I’ve left the Exception event in the events to
track. As a result, we see it
showing up as well.
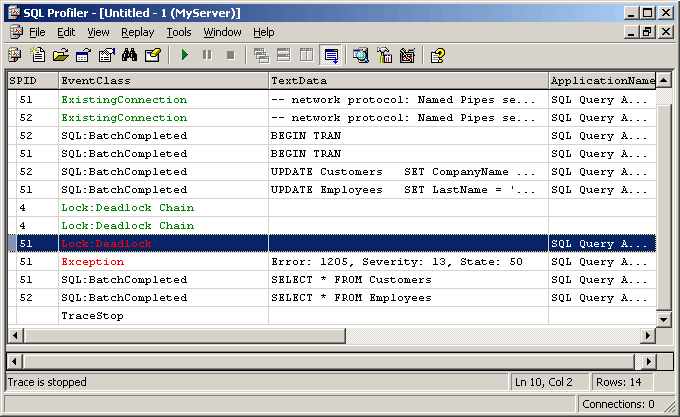
Figure 57: Deadlocking Recorded in
Profiler
Notice the Lock:Deadlock event corresponds to
the connection (SPID) chosen as the deadlock victim. In the case of this example, the SPID is 51 and we can scroll
back through our Profiler trace to see the T-SQL statements leading to a
deadlock. We also have the
statements executing around the same time as our deadlock culprit.
In this particular case, SPID 51 was trying to do a SELECT * FROM Customers when the deadlock
occurred. We would take a closer
look at SPID 51’s commands and compare the two connections.
The last event, Lock:Timeout, isn’t as
useful because by default, SQL Server doesn’t register a lock timeout unless
the client application sets one. A
program can specify a lock timeout by SET LOCK_TIMEOUT.
Otherwise, SQL Server and the application will wait indefinitely for the
locks to clear. If we do set a lock
timeout and the threshold is reached, we’ll see the event in the Profiler
trace shown in Figure 58.
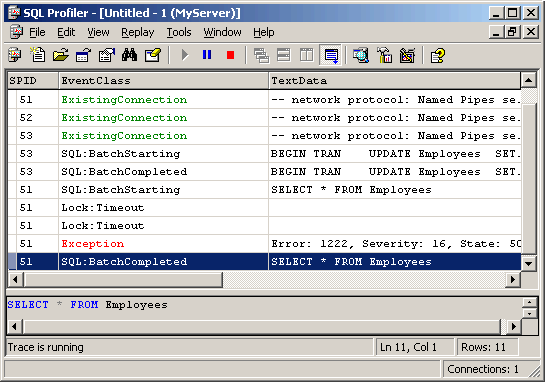
Figure 58: Lock Timeout
Concluding Remarks
Hopefully these three excerpts have whetted your appetite for the Start to
Finish Guide to SQL Server Performance Monitoring. There's a lot more in the
book, including how to capture the data, how to transform it into a readable
format, and how to use the data to spot potential issues ahead of time. I also
cover a step-by-step methodology on performance monitoring, my attempt at trying
to put into a "science" what some consider an "art." The
last thing I'll leave you with is a condensed Table of Contents:
Condensed Table of Contents:
- Performance Monitoring Tools
- A Straight Forward Methodology
- Performance Logs and System Monitor
- Monitoring Locally vs. Remotely
- Real-Time versus "Unattended" Monitoring
- Setting Up a Performance Log
- Choosing the Right Counters
- Spot Checking in an Emergency
- Baselines for the Long Haul
- Responding to Trends
- SQL Profiler
- Creating a Profiler Trace
- Typical Events
- Stored Procedures, Caching, and Recompiles
- Converting Trace Files
- Putting it All Together


