Let me take a moment and do some research to find out which option is the best when you want to use the EXISTS logical operator. Here we are talking about a query like this:
SELECT t.SomeColumn
 FROM MyTable AS t
 WHERE EXISTS(SELECT StarOrOne
          FROM FilterTable ft
          WHERE ft.MyTableID = t.ID)
Listing 1: Hypothetical example of using of the EXISTS logical operator
Question
There are four options that we can use with EXISTS logical operator
- *
- TOP 1 1
- 1
- TOP 1 *
So, which option provides us better performance and readability?
The Experiment
Let's make our initial setup. This script will create two tables with primary keys and a foreign key between them. We also add some data.
CREATE TABLE dbo.Product
    (
        ID INT IDENTITY(1, 1) NOT NULL
       ,ProductName VARCHAR(100)
       ,CONSTRAINT PK_Product
            PRIMARY KEY (ID)
    )

GO

CREATE TABLE dbo.ProductOrder
    (
        ID INT IDENTITY(1, 1) NOT NULL
       ,ProductID INT NOT NULL
       ,CONSTRAINT PK_ProductOrder
            PRIMARY KEY (ID)
       ,CONSTRAINT FK_Product_ProductOrder
            FOREIGN KEY (ProductID)
            REFERENCES dbo.Product (ID)
       ,INDEX IX_ProductID (ProductID)
    )

GO

INSERT INTO dbo.Product
    (
        ProductName
    )
SELECT TOP 1000000
     'Product_' + CAST(ROW_NUMBER() OVER (ORDER BY o.object_id) AS VARCHAR(10)) AS ProductName
FROM sys.objects AS o
CROSS JOIN sys.objects AS o2
CROSS JOIN sys.objects AS o3
CROSS JOIN sys.objects AS o4

INSERT INTO dbo.ProductOrder
    (
        ProductID
    )
SELECT p.ID
FROM   dbo.Product AS p
WHERE  p.ID % 2 = 0
Listing 2: Initial setup script
Now Product table contains 1,000,000 rows and half of them are in ProductOrder table. So, each second Product was ordered. This means each our test query should return 500,000 rows. Once we have the tables set up, we can test our options and take a look at the execution plans of each of them.
Case 1
Let's start with this query, using the "SELECT *":
SELECT p.ID
FROM   dbo.Product AS p
WHERE  EXISTS
    (
        SELECT *
        FROM   dbo.ProductOrder AS po
        WHERE  po.ProductID = p.ID
    )
Listing 2: Case where we use the "SELECT *"
In the picture 1 below you can see that SQL Server using indexes built on top of Product and ProductOrder tables applies the "Right Semi Join" operator to implement the EXISTS logical operator. The "Right Semi Join" guarantees that the only rows from the Product table that have a match in the ProductOrder table are returned.

Picture 1: Execution plan built for the script from Listing 2.
Case 2
With the next query we are going to test the "SELECT TOP 1 1":
SELECT p.ID
FROM   dbo.Product AS p
WHERE  EXISTS
    (
        SELECT TOP 1
              1
        FROM  dbo.ProductOrder AS po
        WHERE po.ProductID = p.ID
    )
Listing 3: Case where we use the "SELECT TOP 1 1"
As you can see in Picture 2 below the execution plan is the same as in Picture 1.

Picture 2: Execution plan built for the script from Listing 3
Case 3
Continue with the "SELECT 1":
SELECT p.ID
FROM   dbo.Product AS p
WHERE  EXISTS
    (
        SELECT 1
        FROM   dbo.ProductOrder AS po
        WHERE  po.ProductID = p.ID
    )
Listing 4: Case where we use the "SELECT 1"
As you can see in Picture 3 below, the execution plan is the same as in the Pictures 1 and 2.

Picture 3: Execution plan built for the script from Listing 4
Case 4
And the last query, using the "SELECT TOP 1 *"
SELECT p.ID
FROM   dbo.Product AS p
WHERE  EXISTS
    (
        SELECT TOP 1
              *
        FROM  dbo.ProductOrder AS po
        WHERE po.ProductID = p.ID
    )
Listing 5: Case where we use the "SELECT TOP 1 *"
Please, believe me these three pictures above and one picture below are four different pictures, I really did copy and paste each of them one by one.
As you can see in Picture 4, the execution plan is the same as in Pictures 1, 2 and 3. Thus, we can be sure that SQL Server query optimizer recognize these four queries as one, regardless what we wrote right after the EXISTS(SELECT...

Picture 4: Execution plan built for the script from Listing 5
What about TOP?
In the queries #2 and #4, by using the TOP try to tell SQL Server to stop scan all following matching rows in the table ProductOrder if it has found at least one match in the table, Product. Even if there are many rows in the table ProductOrder matching a single row in the Product table only that single row should be in the result set. This is exactly the same thing that the "Right Semi Join" operator does. That's why you didn't see the TOP operator icon in the pictures above. But let's be sure that query optimizer did not make a mistake (this is ridiculous, but this is for research only). Below is the example of a query and its execution plan utilizing the TOP operator.
SELECT TOP 1 p.ID
FROM   dbo.Product AS p
WHERE  EXISTS
    (
        SELECT *
        FROM   dbo.ProductOrder AS po
        WHERE  po.ProductID = p.ID
    )
Listing 6: The real TOP operator
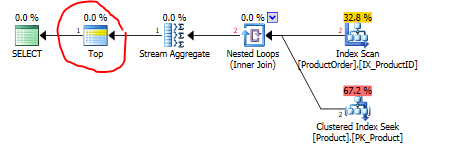
Okay, the TOP operator was not ignored by mistake because it is in Picture 5 surrounded by a red circle. However, the "Right Semi Join" did all the work instead of TOP. So, if there was no mistake by the optimizer, we can ignore the "TOP" word. So, in further research we can look at only queries #1 and #3.

Picture 5: Execution plan built for the script from Listing 6
The Real Performance
I am going to slightly change our SQL code to avoid measuring the time spent by the visual components embedded into SSMS. Instead of outputting all the existing products, let's have only a full count of them: COUNT(p.ID). There will be only one cell in the result grid. This is as simple as possible to render the results.
Starting with #1.
DBCC FREEPROCCACHE
DBCC DROPCLEANBUFFERS

DECLARE @d DATETIME2(7) = SYSUTCDATETIME()
SELECT COUNT(p.ID)
FROM   dbo.Product AS p
WHERE  EXISTS
    (
        SELECT *
        FROM   dbo.ProductOrder AS po
        WHERE  po.ProductID = p.ID
    )
SELECT DATEDIFF(MILLISECOND, @d, SYSUTCDATETIME())
Listing 7: Measuring executoin duration. Case #1

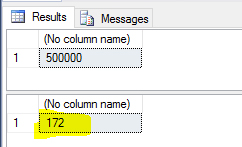
Picture 6: Execution results generated by the script from Listing 7.
It seems on cold data, #1 spent only 172 ms. Let's see what native SQL Server tool says:

Picture 7: STATISTICS TIME ON output generated by the script from Listing 7.
Correction, the spent time is 171 ms.
Let's go to the case #3, but first let's make the data cold by invoking the DBCC commands again.
DBCC FREEPROCCACHE
DBCC DROPCLEANBUFFERS

DECLARE @d DATETIME2(7) = SYSUTCDATETIME()
SELECT COUNT(p.ID)
FROM   dbo.Product AS p
WHERE  EXISTS
    (
        SELECT 1
        FROM   dbo.ProductOrder AS po
        WHERE  po.ProductID = p.ID
    )
SELECT DATEDIFF(MILLISECOND, @d, SYSUTCDATETIME())
Listing 8: Measuring execution duration. Case #3

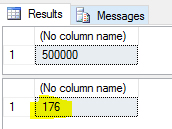
Picture 8: Execution results generated by the script from Listing 8.
Comparing Pictures #6 and #8, do you see a big difference? I don't. What about statistics time?

Picture 9: STATISTICS TIME ON output generated by the script from Listing 8.
For now we have seen that there is no difference in performance between #1 and #3. But, I do not what to give up. Actually, I heard and read many times that case #1 forces SQL Server to expand metadata that, in turn, can lead to a slower compilation. But, how can we check it? Hmm. Let's add 1022 fields to the ProductOrder table. I think the max value of fields must show us at least something interesting about that assumption.
So, the query below can proof that I added 1022 columns to the ProductOrder table.

Picture 10: Query and its result proofing 1024 columns in the ProductOrder table
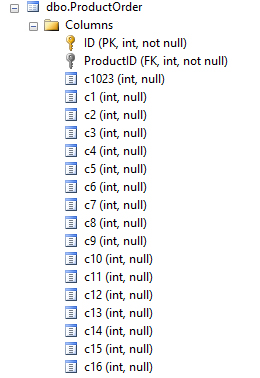
And that's how it looks like

Picture 11: First several columns of the ProductOrder table
It ends at c1022 INT(NULL).
Compilation Speed
We are starting to measure the compilation speed with case #1 and it is going to be

Picture 12: Compilation speed #1
and #3 is going to be

Picture 13: Compilation speed #3
I would say the numbers in Pictures #12 and #13 are the same. But, please remember, both of cases are compiled with 1024 fields. Does it mean that the metadata does not affect compilation duration? It seems yes, it does, but I am not going to say that SQL Server does not expand the metadata in case #1. Perhaps the time spent for that is not included in the STATISTICS TIME ON output. But definitely, the amount of columns doesn't lead to slower compilation. And let me ask you, why should it be slower? Please, see the execution plans above. SQL Server works with indexes only. That's all it needs. And I think only index metadata have been expanded. Let me try to confirm my theory.
Go To Heaps
I dropped IX_ProductID and PK_ProductOrder. This gives me a heap. No more useful indexes on top of the ProductOrder table. It seems SQL Server have no choice and must scan the metadata of ProductOrder table and be teeny-tiny slower because of that.
Starting with #1

Picture 14: Execution plan generated for the heap #1
The compilation time is going to be 8 ms.

Picture 15: Compilation time for the heap #1
Continue with #3

Picture 16: Execution plan generated for the heap #3
And the compilation time is going to be 7 ms.

Picture 17: Compilation time for the heap #3
Again, there is no big difference in the compilation time in Pictures #15 and #17. My theory has been busted even without myth busters. It seems like metadata have been expanded in both cases or have not been expanded at all, it sounds crazy, but who knows. We need more workload and more useful things to measure the compilation time.
Query Store and ostress
Never give up. There could be one more useful test. I am going to compile each query 100 times and take a look at statistics from Query Store. Again,
- The queries are #1 and #3
- The indexes are re-created
- The count of columns in ProductOrder is 1024
- The OPTION(RECOMPILE) is used
SELECT COUNT(p.ID)
FROM   dbo.Product AS p
WHERE  EXISTS
    (
        SELECT 1
        FROM   dbo.ProductOrder AS po
        WHERE  po.ProductID = p.ID
    )
OPTION (RECOMPILE)

SELECT COUNT(p.ID)
FROM   dbo.Product AS p
WHERE  EXISTS
    (
        SELECT *
        FROM   dbo.ProductOrder AS po
        WHERE  po.ProductID = p.ID
    )
OPTION (RECOMPILE)
Listing 9: #1 and #3 with OPTION(RECOMPILE)
The ostress commands were:
 ostress.exe -S"devbox\sql2016" -E -dStarOne -i"c:\temp\SelectStar.sql" -n1 -r100 -q -o"c:\temp\oslog" -b
 ostress.exe -S"devbox\sql2016" -E -dStarOne -i"c:\temp\SelectOne.sql" -n1 -r100 -q -o"c:\temp\oslog" -b
Listing 10: Two ostress commands to compile our queries 100 times each
The query used to check the Query Store is:
SELECT qplan.avg_compile_duration
      ,CAST(ROUND(qplan.avg_compile_duration / 1000.0, 2) AS DEC(15, 2))  AS avg_compile_duration_milliseconds
      ,qplan.last_compile_duration
      ,CAST(ROUND(qplan.last_compile_duration / 1000.0, 2) AS DEC(15, 2)) last_compile_duration_milliseconds
      ,qsqt.query_sql_text
      ,qsrs.execution_type
      ,qsrs.execution_type_desc
      ,qsrs.count_executions
      ,qplan.count_compiles
      ,qsrs.avg_duration
      ,qsrs.last_duration
      ,qsrs.min_duration
      ,qsrs.max_duration
FROM   sys.query_store_query AS q
JOIN   sys.query_store_plan AS qplan
    ON qplan.query_id = q.query_id
JOIN   sys.query_store_query_text AS qsqt
    ON qsqt.query_text_id = q.query_text_id
JOIN   sys.query_store_runtime_stats AS qsrs
    ON qsrs.plan_id = qplan.plan_id
WHERE  q.query_id IN (1, 2)
Listing 11: Query Store query
It worth noting that I ran ostress many times and I saw different results. Here I am going to show you some of them to give you a clearer picture. Actually, I do not understand why avg_compile_duration always equals last_compile_duration while count_compiles is 100. Also, I am not sure what the measurement unit for avg_compile_duration is. I saw there were numbers like 5.123, 5123, and 51.123. That's why you can see "avg_compile_duration / 100 AS avg_compile_duration_milliseconds" in my script. But again, as last_compile_duration always matches to avg_compile_duration I would think that last_compile_duration reported in microseconds. Because 6,78 is very close to the numbers we had above from STATISTICS TIME ON output.
The three pictures below are the pictures I promised you. These are showing the three runs of the Listing 10. Results of course obtained by the Listing 11. And these three runs were made with 1024 columns in the ProductOrder table. In each picture you can see both of our cases #1 and #3 one-by-one.

Picture 18: Run 1 when count of columns is 1024

Picture 19: Run 2 when count of columns is 1024

Picture 20: Run 3 when count of columns is 1024
These three pictures below show the results of the Listing 10 but count of columns in the ProductOrder table is 2.

Picture 21: Run 1 when count of columns is 2

Picture 22: Run 2 when count of columns is 2

Picture 23: Run 3 when count of columns is 2
Wow, I am surprised a lot because the compilation time is less in both cases #1 and #3 when count of columns is 2 than when it is 1024. Let's write down all the numbers to have a full picture.
| Case | Columns in ProductOrder table | First Run | Second Run | Third Run | Avg | Avg-Avg |
|---|---|---|---|---|---|---|
| SELECT * (#1) | 1024 | 6.73 | 7.08 | 6.62 | 6.810000 | 6.80666650 |
| SELECT 1 (#3) | 1024 | 6.78 | 6.76 | 6.87 | 6.803333 | |
| SELECT * (#1) | 2 | 4.82 | 4.83 | 4.86 | 4.836666 | 4.87999950 |
| SELECT 1 (#3) | 2 | 4.93 | 4.87 | 4.97 | 4.923333 |
Table 1: Comulative compilation duration
Let me explain what surprises me with numbers. As 6.810000 is very, very close to 6.803333 and 4.87999950 is much lower than 6.80666650, I think that #1 and #3 are both affected by a large number of columns. That's why I am surprised a lot.
The Last Test with 1000 Runs and Compiles
To be sure that the 100 compiles show up a real picture I am going to make exactly the same tests as above with the Listing 10 but now run the compilation 1000 times.

Picture 24: 1000 compiles when count of columns is 1024
And one more run

Picture 25: 1000 compiles when count of columns is 2
The pictures #24 and #25 show the identical tend that Table 1 does. So, we can be sure in results.
Conclusion
I do not see a big difference in performance between #1 and #3. You can use whatever you want. It could depend on your religion if you have one. But please, be aware that sometimes you are going to have a concern in a code review about using the *. Just this symbol is like a red flag in front of a bull. You know what I mean.
One note. You definitely spend more time when you touch two keys "Shift + 7" to type the *, than when you type just "1". But, I am not going to research how much more time you spend.

