After working with Power BI for a few days, I got stumped when attempting to edit the Column Headings on a Table Visual. The internet advised me … there are currently no options to change column header names for a Table/Matrix visual. It appears lots of people would like to see this functionality added.
So while we wait (and hope) for the feature to be added … here is one idea for a “work around”!
The Problem
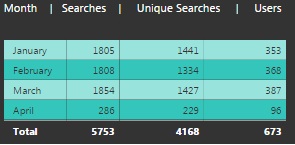
I created the table visual below with the default column headings;

In Power BI, column headings are generated using Field names from the dataset. Sometimes the field names may not be relevant or not quite fit what you wish to show an ‘end-user’. Note the format of “MonthName” or the ambiguity of column name ‘ID’.
I will show you a method that allows to you display whatever column headings you wish. The example shows “MonthName” as Month and “Searches” instead of “ID”.

Step 1
Starting with the table:

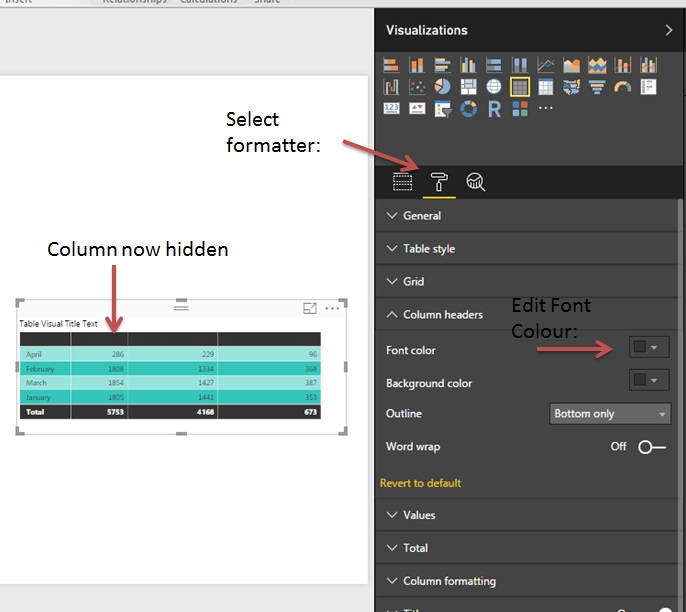
Select Formatter and change the Column Header: ‘Font colour’ to match the background colour.

Step 2
While still in Formatter, select: set Background toggle to on. Change the Transparency slider to 0% and change the Colour to match the column header background colour.

Step 3
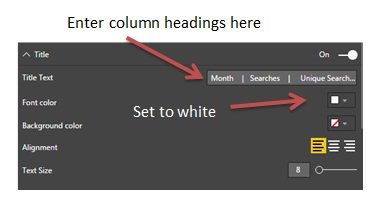
While still in the Formatter, Select Title and change the Font Colour to ‘White’. Enter into Title Text, the column headings as you wish they appear
My example string was: Month | Searches | Unique Searches | Users

Note: To get your column headers to display for your examples. It’s a case of playing around with the spacing and column delimiter to find a ‘best fit’.
Conclusion
Following the above steps gives you the option to display more relevant column names without creating an alias or pseudo columns. I imagine there will be a more eloquent ways to achieve the similar effect. If you have any ideas, please share in the discussion for this article.
Hopefully the really clever Microsoft people will create this functionality in a Power BI update coming to us soon. Personally I think it would be a useful option.


