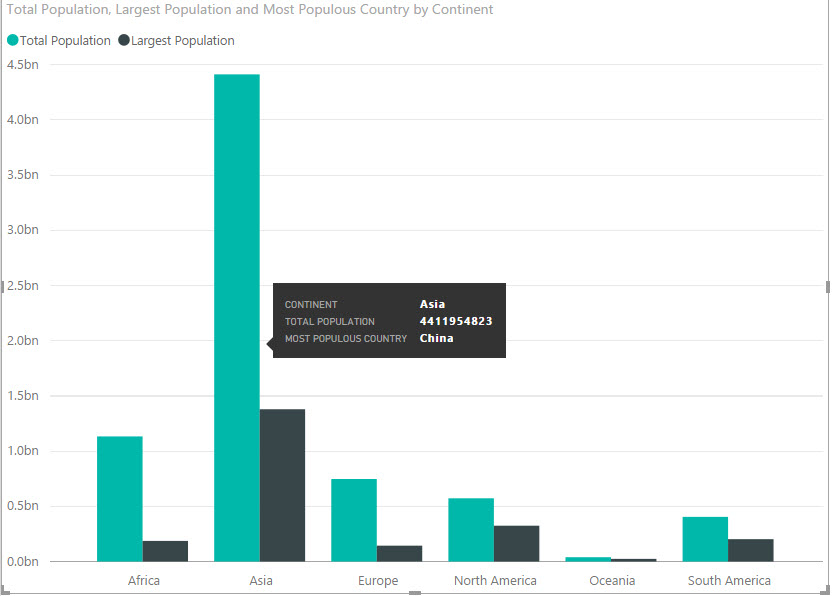
Introduction
When we think about measures in SSAS Tabular, we typically assume a numeric output. In this article, I'd like to present the case for non-numeric measures. Firstly we'll look at what a non-numeric measure is, then identify use-cases, and finally move through a couple of ways to create them. In the final section, we will also look at methods to deal with any complexities that may arise.
For the intial examples in this article, I'm going to use a simple table of all the countries in the world, with their population and land area. This data was sourced from Wikipedia. Both an Excel spreadsheet with the data, and a PowerBI desktop file that includes all the measures created in the examples, are included for download (see the Resources section).
Below is an sample of the data. I added the continents manually, so any inaccuracies are my own fault.

Later in the article I'm going to use another dataset, the winners of each edition of the FIFA Football World Cup. Although this is a tiny dataset, the data distribution allows me to demonstrate some of the issues that you are likely to run into when creating non-numeric measures.
How can a measure be non-numeric?
DAX is an incredibly versatile language, and the range of values that can be returned by a DAX calculation is not limited to numeric values. You can set up a measure that returns a boolean, date or even text value. As DAX grows in popularity, I wouldn't be surprised if we will even be able to create measures that return images or media. Creating a measure with one of these data types is as simple as writing a formula which returns a non-numeric value.
Ok, so you CAN create non-numeric measures. But WHY would you?
Most of us first learned about measures by using Pivot Tables in Excel. Even this SQLBI article about Calculated Columns and Measures defines the use case for measures as follows:
...you must define a measure whenever you want to display resulting calculation values that reflect user selections and see them in the values area of pivot tables, or the plot area of a chart...
Clearly you cannot display a non-numeric value in the plot area of a chart, so we will have to assume that the use case for non-numeric measures relates to displaying values in a pivot table. From a dashboarding perspective, I also like to display non-numeric values on Cards.
So what situation would lend itself towards displaying a text, Boolean or date in the values of a pivot table?
Best and Worst Performers
The simplest, and probably most useful reason to create a non-numeric measure, is to display the top/bottom performing item in a category.
Looking at our sample data, it is immediately apparent that finding the largest country population per continent would be very simple.
Largest Population := MAX([Population])
Using this measure would yield a result as follows.
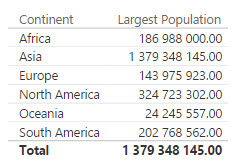
Notice that, as with all measures in DAX, the result is context specific. So in the total row, we see the single largest population across all countries in our dataset, but in the other rows it is the largest per continent.
There are many use cases in which this measure would be perfectly adequate, but my immediate question when looking at this data, is which countries are actually being represented in this data. It would be far more useful for me to actually see the name of the country with the largest population, like this.
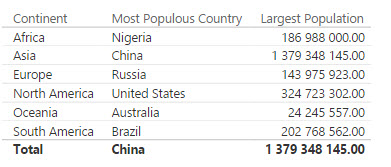
This is a much more useful output, and is adaptable in numerous situations. Highest Population Density, Smallest Land Area, etc. can all be created and added to the model.

As you can see in the image above, you can even add a numeric value to the measure to make it even more descriptive.
Other uses
Although we don't have any date data, I'm sure it is not too difficult to imagine a situation where you would apply similar logic to return the most popular or least popular dates for a certain occurance. In addition, we can see the first and last occurances of an event using a date valued measure.
- Date on which we sold the most of each category of product?
- First date that we sold a specific item per store?
- Most recent resignation per department?
All of these questions and more can be answered by creating a measure which returns a date.
In a similar vein, it is possible to create a measure which returns a boolean value.
- Has a car salesman acheived his target per period?
- Does a specific continent have any countries with more than 50 million people?
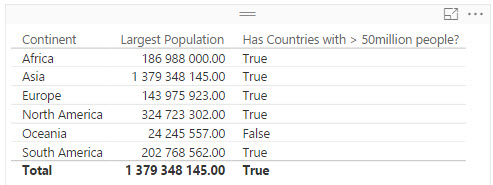
Hopefully you can see the value of non-numeric measures from the examples above, and you're interested to learn how quck and easy it is to create them.
I'm sold. Teach me how!
Boolean valued Measures
Let's start with the last example (Has Countries with > 50 million people?), as it requires the fewest concepts you may not have experienced before.
There are other ways to create this measure, but for now I'm going to do it in a 3-step method. This may take a little longer, but it is hopefully very clear to even the most inexperienced DAX coder.
Step 1: Create a measure which counts the number of rows in the table.
# of Countries = COUNTROWS('Area and Population Data')Step 2: Create a measure which applies a filter to the [# of Countries] measure I just created to count the number of countries with more than 50 million people.
# of Countries (Population > 50million) test = [# of Countries]('Area and Population Data'[Population] > 50000000)Note: If you haven't seen this notation before, it is a alternate way of writing the FILTER function. The second part of the statement, in parentheses, is the filter condition, and the first part is the measure applied to the filtered table. We could just have easily have written the measure as follows.
Alternate Syntax = COUNTROWS(FILTER('Area and Population Data';[Population]>50000000))Step 3: Evaluate whether or not the previous measure has a value of > 0 and return the boolean result.
Has Countries with > 50million people? = [# of Countries (Population > 50million)] > 0
By putting these 3 measures on a table, I can now see how they work.

So far we've looked at calculations that will return one, and only one, value. This makes the behaviour of the measure predictable, and means that we don't have to consider exceptional cases. However, the same is not true when we start looking at text valued measures.
Text valued Measures
Let's have a look at a different data set, one to do with football.
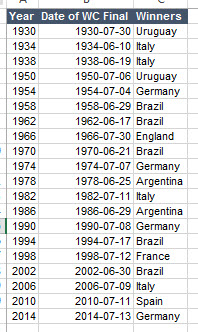
The FIFA World Cup only takes place every 4 years, and was suspended during World War II, so this table contains the entire dataset for 84 years worth of World Cup Finals.
I've chosen this dataset for the next section becuase it will demonstrate the number one problem we experience with Non-Numeric measures: how to deal with multiple valued answers.
Let's start by looking at a very simple text measure. For each country, I want to see the year in which they won the World Cup.
There is a simple way to do this by using VALUES()
World Cup Winners = VALUES('World Cup Wins'[Year])This works fine.

But only if I only select records where there is only a single value returned.
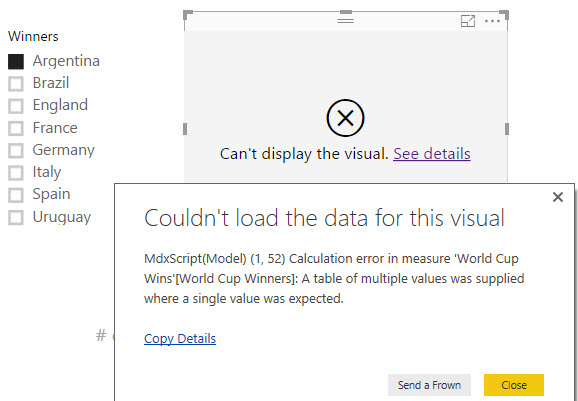
As the error message explains, as soon as 2 values are returned, the VALUES() can longer be used as a measure. This post explains why, along with a number of other uses for the function.
So we have to modify the formula to deal with this problem; one way is to check whether there is only one value, and create a variable calculation to deal with the case where multiple rows are present. PowerPivotPro has a lovely post explaining this technique, where they express it far more eloquently than I ever could.
In the example below, I use the VALUES() method for rows with a single value, and I just display the number of wins for any records where there are multiples.
World Cup Winners (switching) = IF(COUNTROWS('World Cup Wins') = 1;VALUES('World Cup Wins'[Year]);COUNTROWS('World Cup Wins')) 
Excellent, this works as we expected. However, someone who was viewing the report for the first time would struggle to understand what was going on here. Even so, this is often still a good solution, though you could possibly clean it up a little.
World Cup Winners (switching) = IF(COUNTROWS('World Cup Wins') = 1;VALUES('World Cup Wins'[Year]); FORMAT(COUNTROWS('World Cup Wins'); "0") & " World Cup Wins" ) 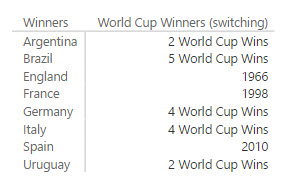
This is definitely cleaner, and easier to understand at a glance. However, we know that the number of data points is pretty small, and it grows slowly, so surely there's a way we can use another method to just list all the wins?! Not surprisingly, given the versatility of DAX (and the fact that I spent time writing the previous sentence), there is a function that allows us to do this. That function is CONCANTENATEX().
CONCATENATEX() allows us to concatenate the values in a column into a delimited list.
World Cup Wins (concat) = CONCATENATEX('World Cup Wins'; 'World Cup Wins'[Year]; ", ")Alternatively, if I want to see them in a specific order (in this case, descending by Year).
World Cup Wins (concat) = CONCATENATEX('World Cup Wins'; 'World Cup Wins'[Year]; ", "; 'World Cup Wins'[Year]; DESC) 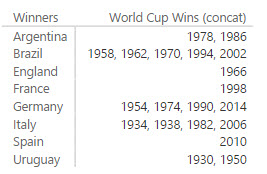
Top and Bottom Performers
If there is a tie, in order_by values, at the N-th row of the table, then all tied rows are returned. Then, when there are ties at the N-th row the function might return more than n rows.
Most World Cup Wins = CONCATENATEX(TOPN(1; VALUES('World Cup Wins'[Winners]);[World Cup Wins];DESC);'World Cup Wins'[Winners];", ")
TOPN(1; VALUES('World Cup Wins'[Winners]);[World Cup Wins];DESC)
Bonus
