As a DBA, you probably manage hundreds of databases, if not thousands. Each of these databases has at least two devices and each of these devices may grow (or shrink), either through autogrowth, scripting or manual interventions. Even if we do not consider the creation or deletion of databases or the addition of devices, you may be facing a lot of changes on the storage solution that underlies your database files. In most cases, these changes tend to gradually fill up your disks.
Build a repository
If you want to manage that process of database disk usage (capacity management?), you will require history data. You will need a way to record information about your database files and store that data in a repository. A process like that will put you in the know about changes taking place and will allow you to do some basic trending.
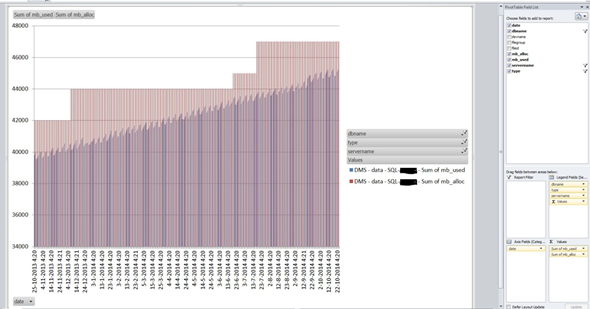
That is exactly what the PowerShell script outlined below will do for you: pull out information regarding size and usage of database devices from your database servers and store that information in a history table. You can then report on the data using tools such as Excel PivotChart or your own favorite graphing solution, and monitor trends. Or you can zoom in on a single database, to see the relation between the size of a data file and its usage. An example is shown below, where the red, block-shaped graph represents the growth of a database’s physical data file (.mdf) over the past year. The blue, spiked graph shows the increase in data inside the physical file over the same period.

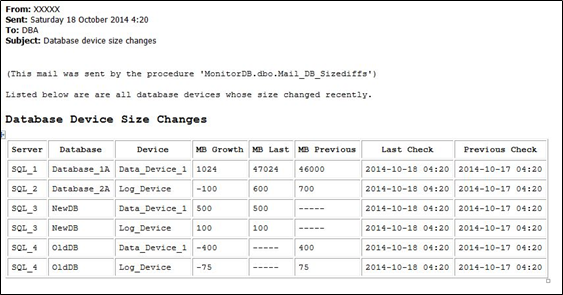
As an added bonus, the script can be configured to send an email alert in case it has encountered any file changes since its last run. Without this alert, changes may go unnoticed. The mail below is shown as an illustration: it informs us of several changes that took place between November 14 and November 15: a log file growth (line 1), a log file shrink (line 2), creation of a database (lines 3-4) and deletion of another (lines 5-6):

Requirements
The script requires PowerShell v 2.0 or higher and the SQLPS module (included with SQL 2012) to connect to your SQL Server instances. It has been tested against SQL 2012, SQL2008 (R2) and SQL2005 servers. If used with a configuration file containing the names of your SQL server instances, the script will poll each of these and record details about their database devices. If used without such a file, it will query only the local server. In case you want to receive email reports of changes, make sure you have configured Database Mail in SQL Server.
Setup and configuration
On the server you decide to use to run this script (called Monitor Server below), you need to copy the PowerShell script to a directory of your choice.
If you want to monitor device changes on remote SQL servers, create a text file that contains the SQL instance name(s) whose device usage you want to monitor, one per line, unquoted. (For a named instance, use a backslash between server and instance name: server01\sql01). In the PowerShell script, specify path and name of this file on the line that starts with $ServerFile=, for example: $ServerFile = D:\Monitoring\servers.txt.
If you want to monitor device changes only on the local server, comment out the line in the PowerShell script that starts with $ServerFile= by adding a pound sign (#) at the start of the line.
Next, create a SQL database that is about 25-50 MB in size. Name it MonitorDB or any other name you specify for $ManagementDB in the User Defined Parameters. Make the Windows account running the script is the dbo of this database and can log on. Make sure the Windows account you use to run the script is entitled to perform DBCC sqlperf(logspace) and DBCC SHOWFILESTATS on the SQL server(s) and databases you query.
To receive email-alerts of changes in database device size, copy the separate SQL script file to your monitoring server, and change the database name if necessary. Replace the placeholders for the email recipient(s) and mail profile. Create the stored procedure in the database you have indicated in the PowerShell script. In the PowerShell script, change the value in the line $SendMail=0 to 1.
Make sure you have PowerShell version 2 or higher installed on the Monitor Server. Install the SQLPS module on the Monitor Server. If you want to run the PowerShell script from a SQL Server Agent job, install the SQLPS module in a system directory included in in the PowerShell variable $env:PSModulePath, for example the directory C:\Windows\system32\WindowsPowerShell\v1.0\Modules\. If not, you need to do special configuration to enable access to the SQLPS module for the account that runs the SQL Server Agent job.
In PowerShell make sure you can run external scripts, e.g. by issuing the command
set-executionpolicy remotesigned -force, or sign the script.
You are now ready to start logging database device sizes. First, run the script from the PowerShell command line to make sure everything works:
CD D:\Monitoring
.\ Record_Device_Usage.ps1
When the prompt returns, check whether a table dbo.dbspace was created in the database you specified and whether it contains any rows. As a test, you could add a single MB to a log device and rerun the script. If you configured the script to email you, there should be a mail detailing the change in the log device.
Scheduling
To build up a history, you can schedule the script to run on a daily or a weekly basis. Scheduling can be done either from the Windows Task Scheduler or as part of a SQL Agent job.
In Task Scheduler, create a task and in the Actions tab choose New. Action type should be Start a program. For Program/script type powershell.exe. Under Add arguments supply the full path to the PowerShell script (avoid spaces if at all possible to avoid parsing problems) and save the task.
In a SQL Agent job step, for Type choose Operating system (CmdExec) and in the Command windows type:
powershell.exe -command "& 'd:\monitoring\record_device_usage.ps1'"
(or any other path you are using).
Conclusion
In environments with many databases the task of monitoring and predicting database growth rates can be a challenging one. It requires that you have accurate historical data, because past behaviour is often indicative of future behaviour. This script will help you maintain the history of database device sizes and database usage and allow you to run reports and do trend analysis.


