Introduction
As a Data Analyst, it is often essential that you dive deep into the visual metrics that are being summarized and displayed on the dashboards or reports to perform your analysis. To aid such an analysis, we need to be able to know all the various dimensions of the business on which the metrics are being calculated. We should be able to drill through each of those dimensions to arrive at a specific conclusion for our analysis.
In this article, I will talk about the "Drill Through Action" feature that is available in SSAS. I'll demonstrate how to fetch results using the DRILL THROUGH MDX statement and also walk you along how to build such a drill-through action in an already existing SSAS cube. These actions can be deployed along with the cube and then used through any client application like excel.
Solution
This article assumes that you're familiar with building dimensions and cubes in SSAS and writing MDX statements. If you still need to learn the basics of SSAS, you can follow the official documentation from Microsoft.
For the sake of this tutorial, I'll be using a sample cube that is built using the WideWorldImportersDW database. You can download the sample here. Before deploying, be sure to modify the Project properties to point to your SSAS server and the Data Source to point to your copy of WideWorldImportersDW.
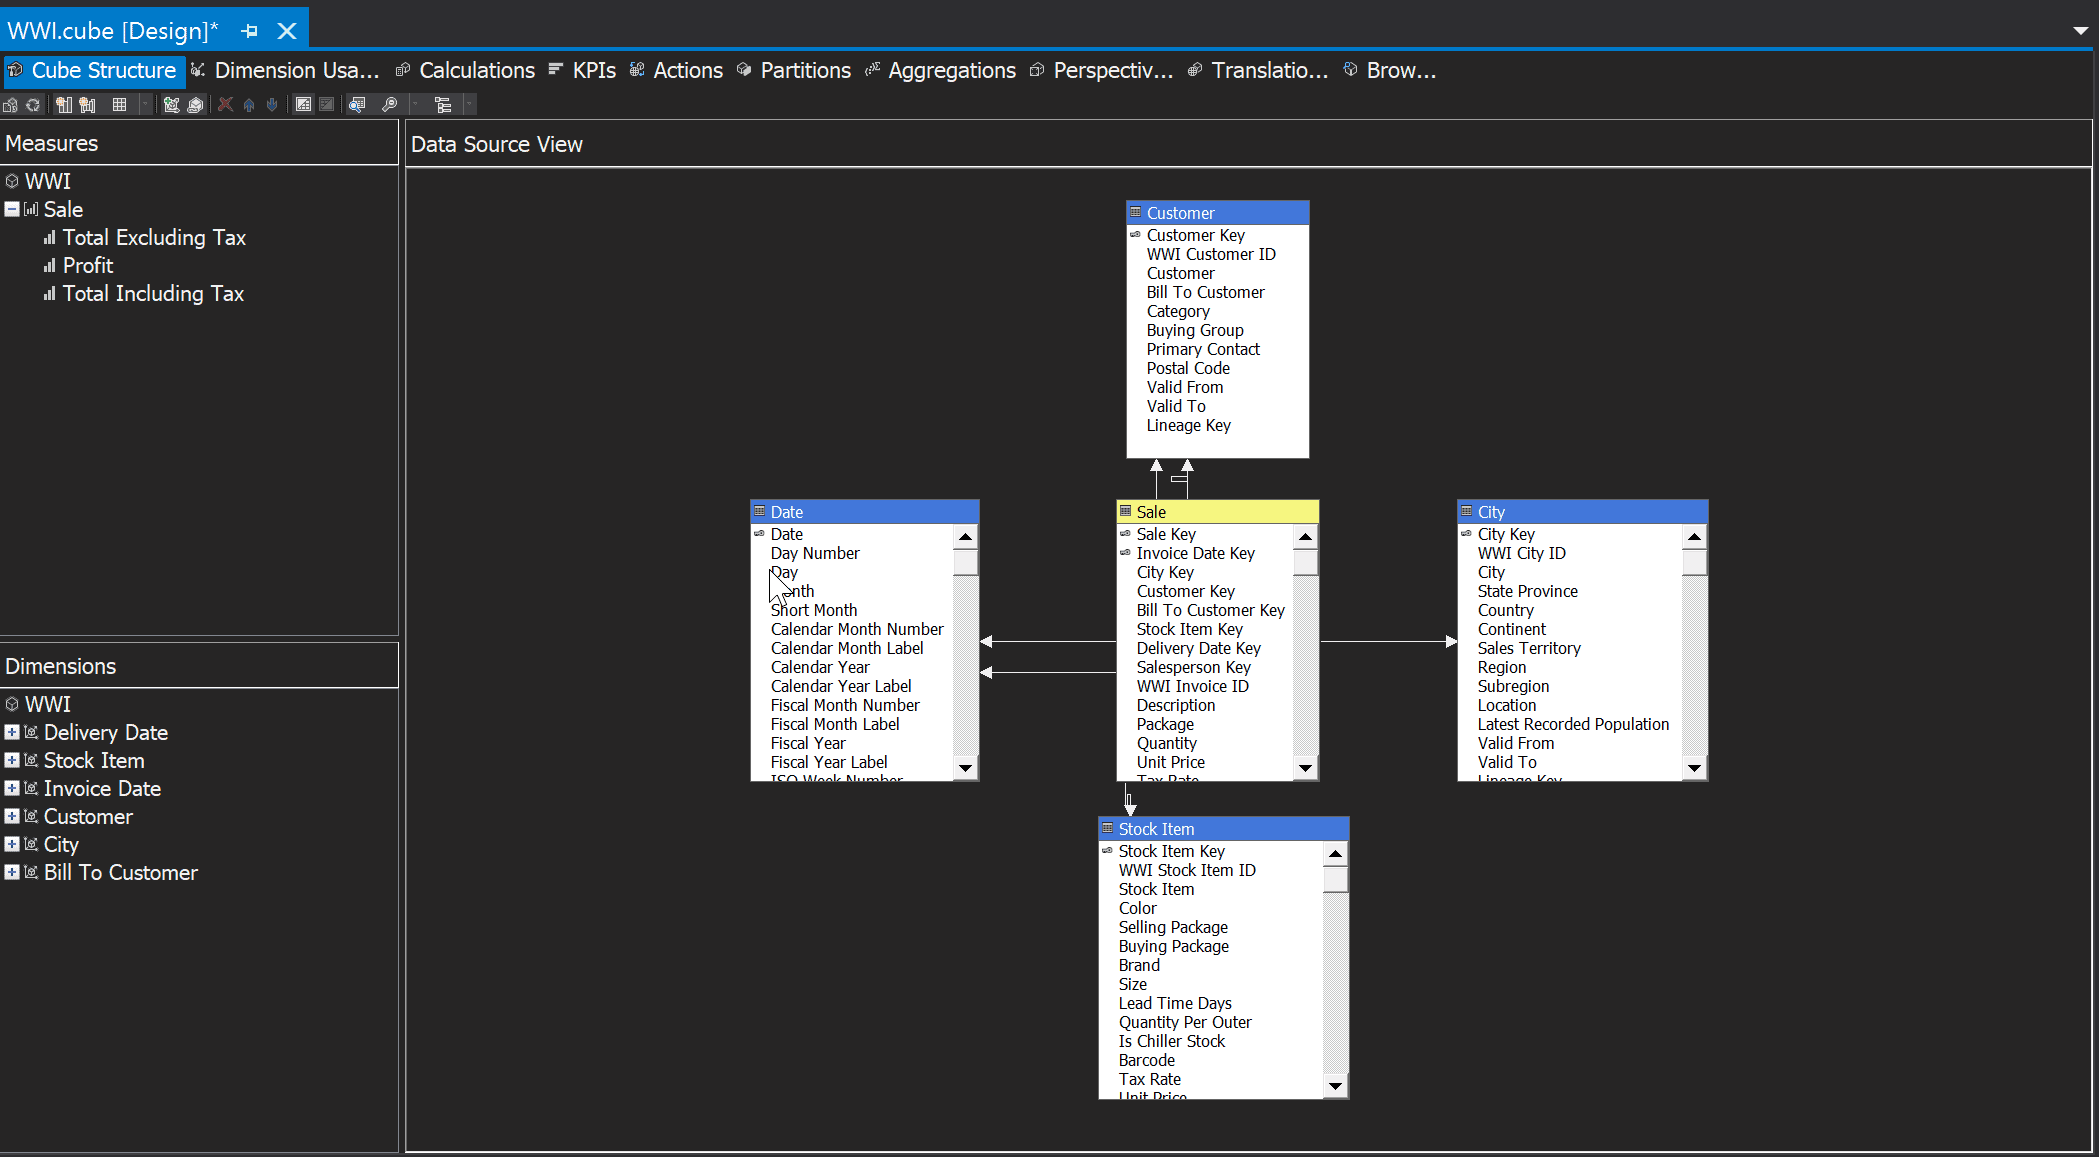
The diagram of the cube is shown below.
Drill Through using MDX
The most important thing when it comes to drill through in SSAS is that this feature can be implemented only if the result set returns a single cell. In other words, the Drill Through functionality in SSAS works on a cell-based value and not on a range of cells. If you need to find the details for a range of values, then you need to find the details for each cell one by one. There is no way to extract detailed information on a range of cells using this method.
As you can see in the figure above (Fig 1), we have four dimensions - Customer, City, Stock Item and Date that intersect with the fact - Sale. Let us explore the Stock Items and the Delivery Dates and try to find out the total Sales that have been completed for one Stock Item in one day.
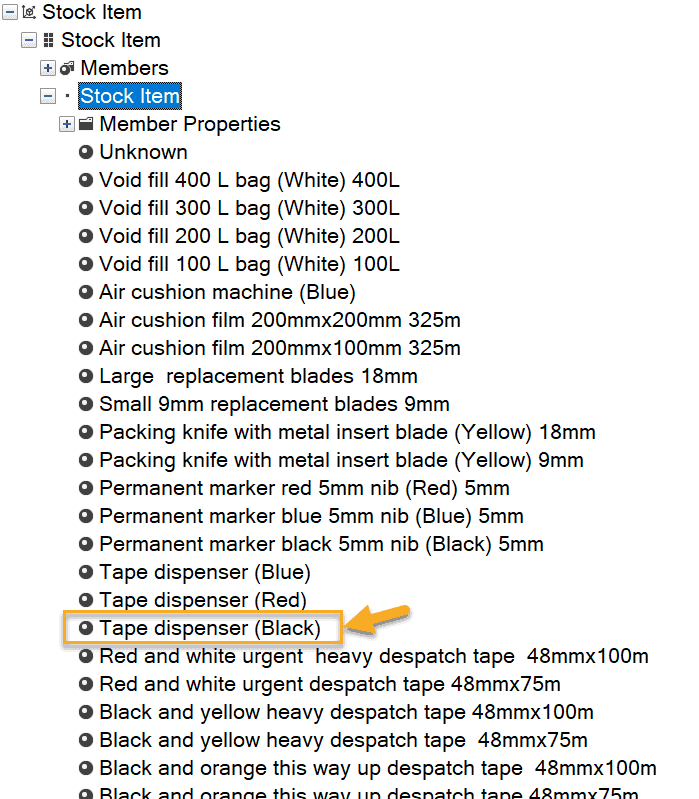
Exploring the Stock Item dimension using SSMS.
Exploring the Delivery Date dimension using SSMS.
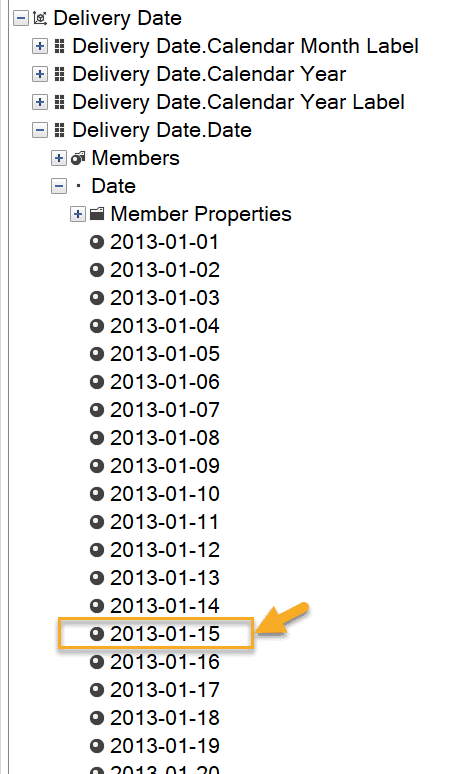
In this case, let's consider the following -
- Delivery Date - 15-Jan-2013
- Stock Item - Tape Dispenser (Black)
Let us now write an MDX statement that will fetch the sum of total sales including taxes for the Stock Item - Tape Dispenser (Black) and for 15-Jan-2013.
SELECT

{[Measures].[Total Including Tax]} ON COLUMNS,

NON EMPTY {

[Stock Item].[Stock Item].[Stock Item].&[17] *

[Delivery Date].[Date].[Date].ALLMEMBERS

} ON ROWS

FROM [WWI]
When you execute the query above, the following result set is obtained as in Fig 4.
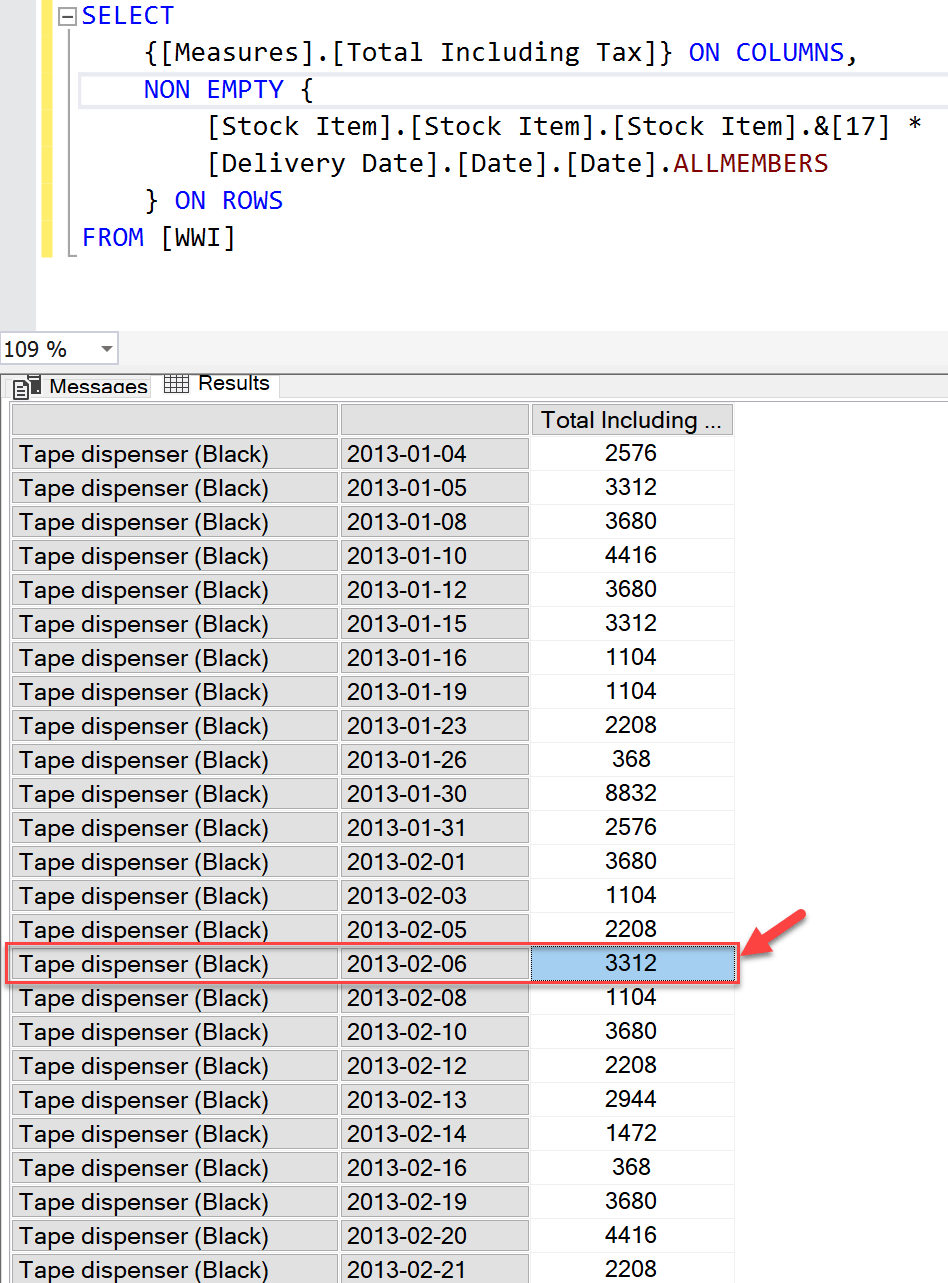
In the screen print above (Fig 4), we would like to see more details about the Customers and the City from which the sale has been made. In order to do so, we need to fetch the Sales value in a single cell using MDX. This single sales value will be then used as the base to calculate the drill through action.
Let us modify the MDX query such that we obtain the Sales value in a single cell only.
SELECT (

[Measures].[Total Including Tax],

[Stock Item].[Stock Item].[Stock Item].&[17],

[Delivery Date].[Date].&[2013-01-15T00:00:00]

) ON 0

FROM [WWI]
When you execute this query, the result set is obtained in a single cell. Notice how the query is modified to fetch the desired results.
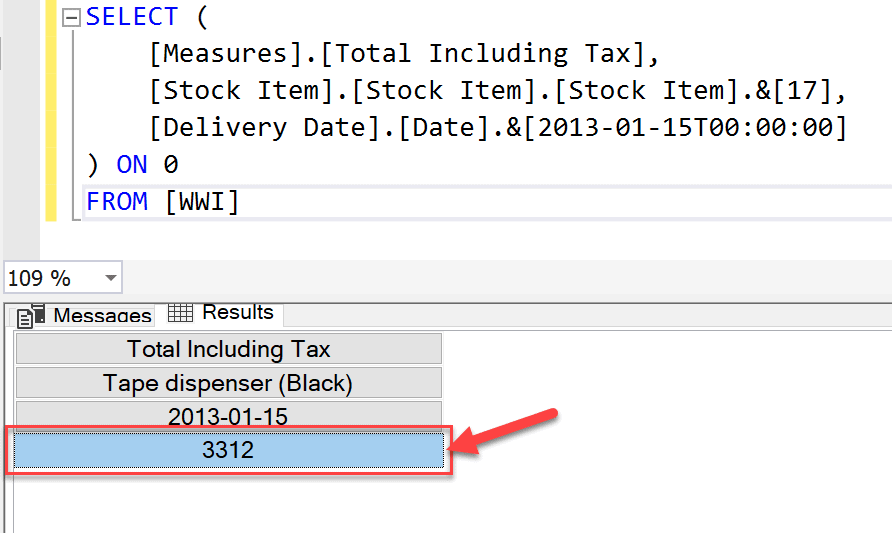
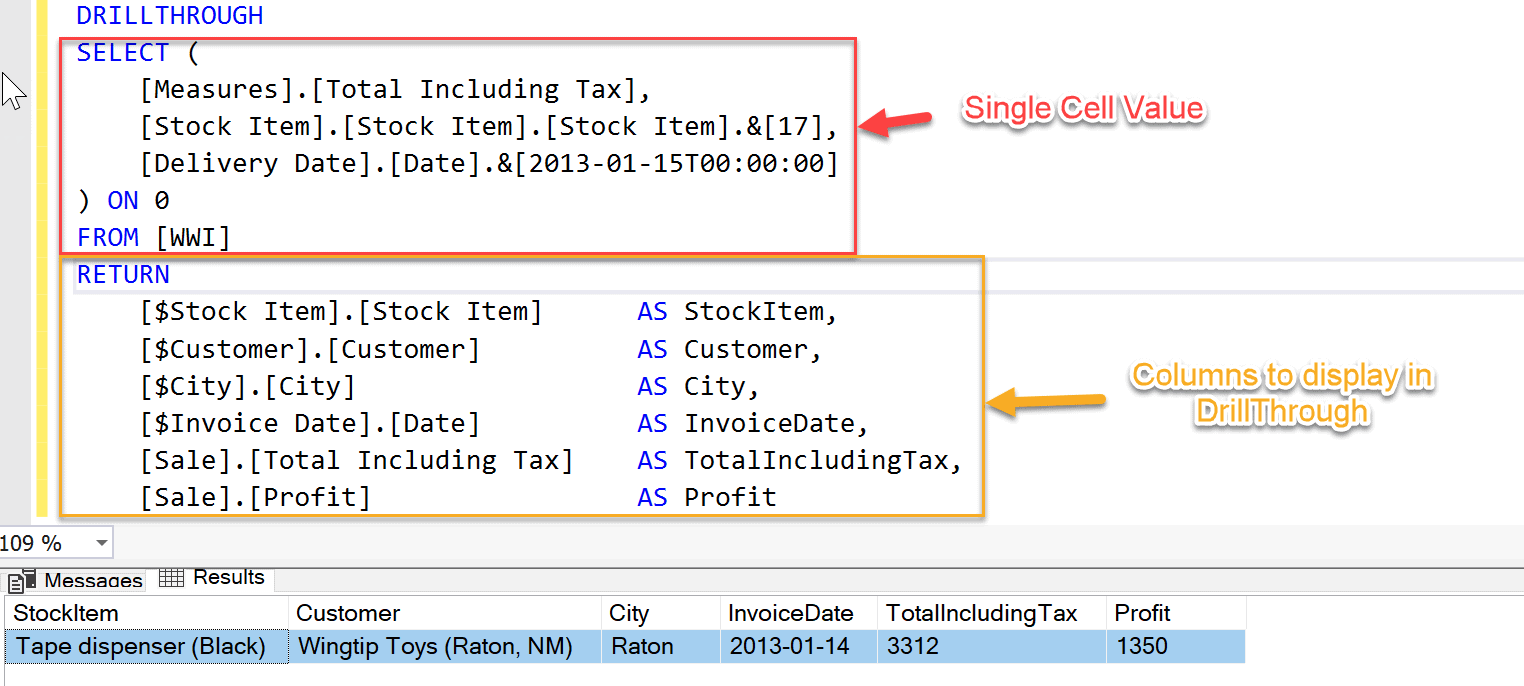
Now that our base for the Drill Through calculation is ready, let go ahead and write the query.
DRILLTHROUGH

SELECT (

[Measures].[Total Including Tax],

[Stock Item].[Stock Item].[Stock Item].&[17],

[Delivery Date].[Date].&[2013-01-15T00:00:00]

) ON 0

FROM [WWI]

RETURN

[$Stock Item].[Stock Item]AS StockItem,

[$Customer].[Customer]AS Customer,

[$City].[City]AS City,

[$Invoice Date].[Date]AS InvoiceDate,

[Sale].[Total Including Tax]AS TotalIncludingTax,

[Sale].[Profit]AS Profit
When you execute this query, it returns a detailed view of all the columns that we have specified in the RETURN statement of the query. Notice that the result set returns a row with the name of the customer, the city to which they belong, the Invoice Date and the Profit. This information was not available in the high-level summarised information, and thus a drill through helps us to fetch more information from the summarized information.
Drill Through using Actions in Cube Designer
As I have already demonstrated, how to achieve detailed information using DRILL THROUGH by writing specific MDX queries. It is not a very user-friendly way of doing it. Often, the customers or the analysts have little knowledge about writing MDX statements and it might become difficult for them to extract such meaningful information.
In order to help the customers and analysts, we can implement the DRILL THROUGH feature directly in the SSAS cube. This feature will be available whenever the users choose to drill into more specific details of the summarized data. Let us now see, in a step-by-step manner, how can we implement the above using the SSAS cube designer.
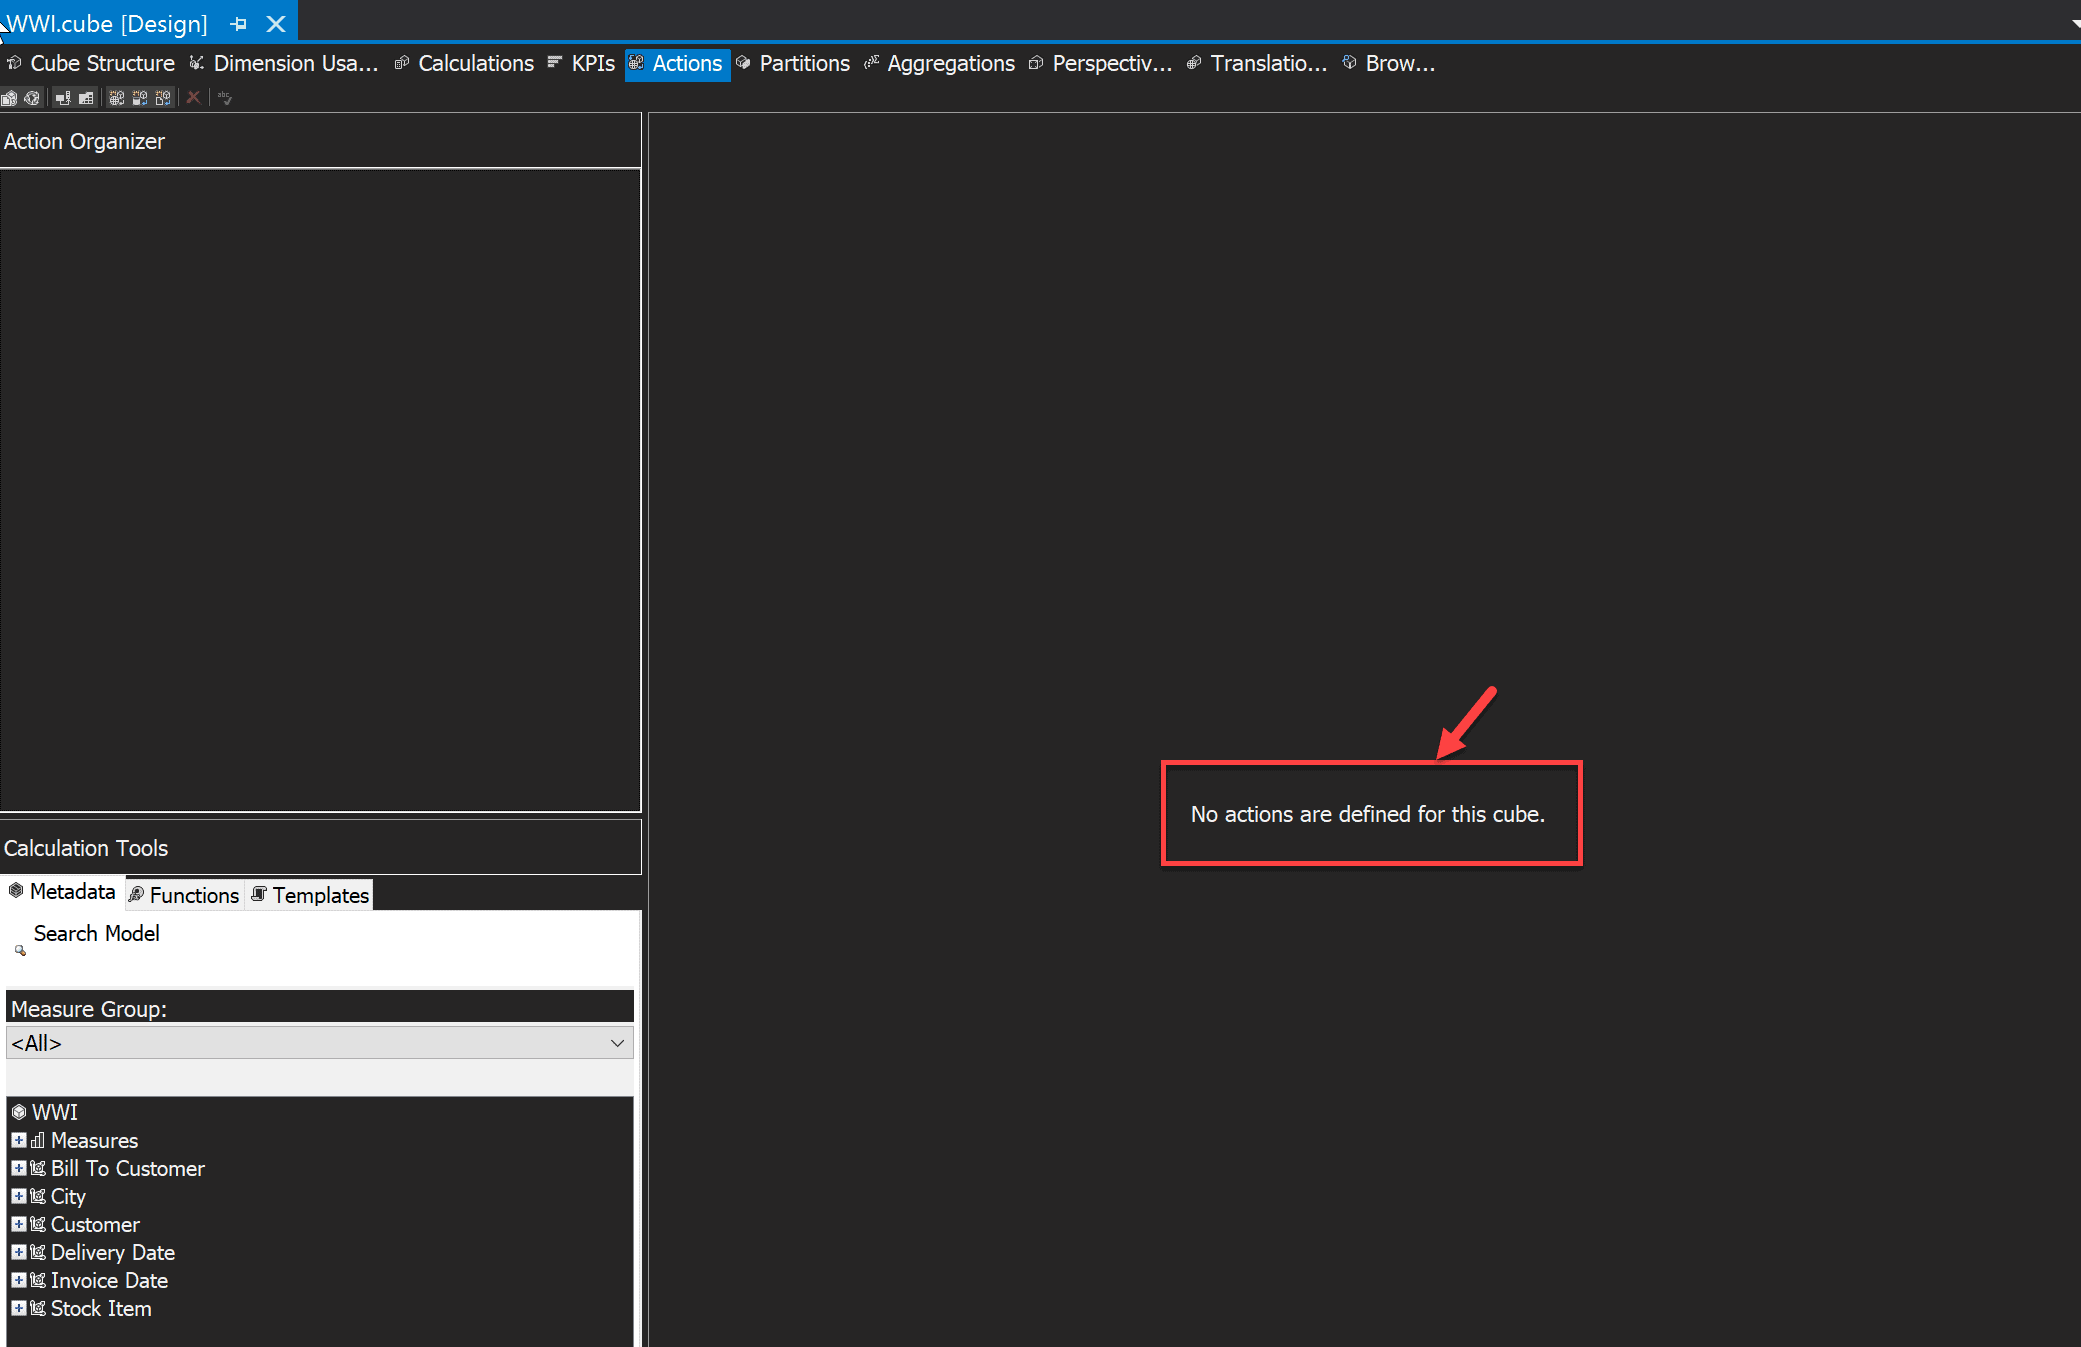
- Once your cube is deployed, navigate to the "Actions" tab in the cube designer.

Fig 7 - Actions Tab - In the Actions tab, you can see that there are no actions defined for this cube. Let's go ahead and create one.

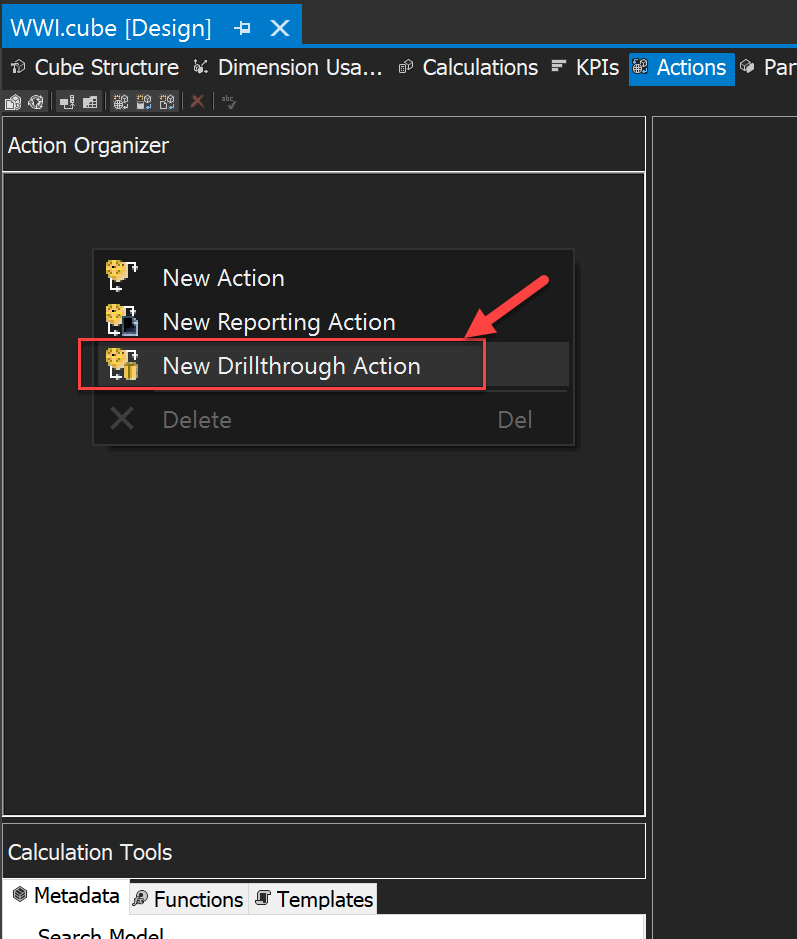
Fig 8 - No actions in the cube - Right-click on the Action Organizer, and select "New Drillthrough Action".

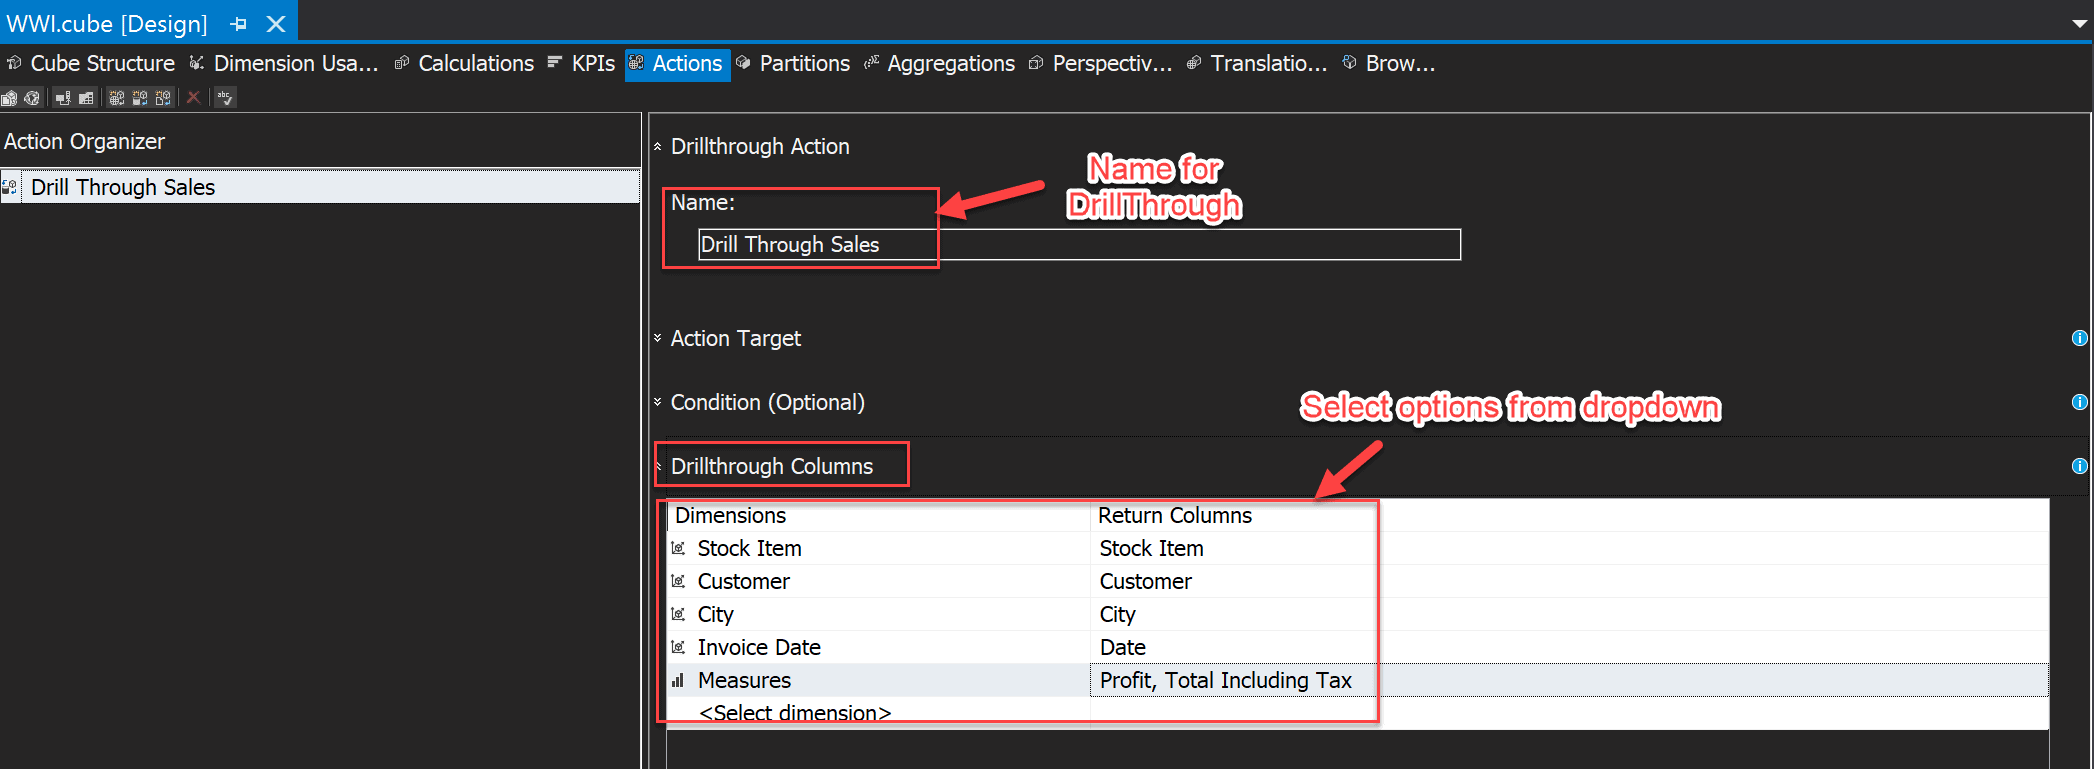
Fig 9 - New Drillthrough Action - The New Drillthrough Action window appears. Provide a name for the action and select the Drillthrough Columns.
- To select the return columns, you need to select the Dimensions on the left-hand side and then select the respective Return Columns from the right-hand dropdown menus.

Fig 10 -Defining Drill Through Action - The final step is to build and deploy the cube.
Now that our cube is ready, we can use a client tool like Excel to explore the detailed information and leverage the functionality of the Drillthrough Action that we just created.
Leverage Drill Through Actions in Excel
First, we should create a connection in Excel to the SSAS cube that we just deployed in the previous step and fetch the required data.
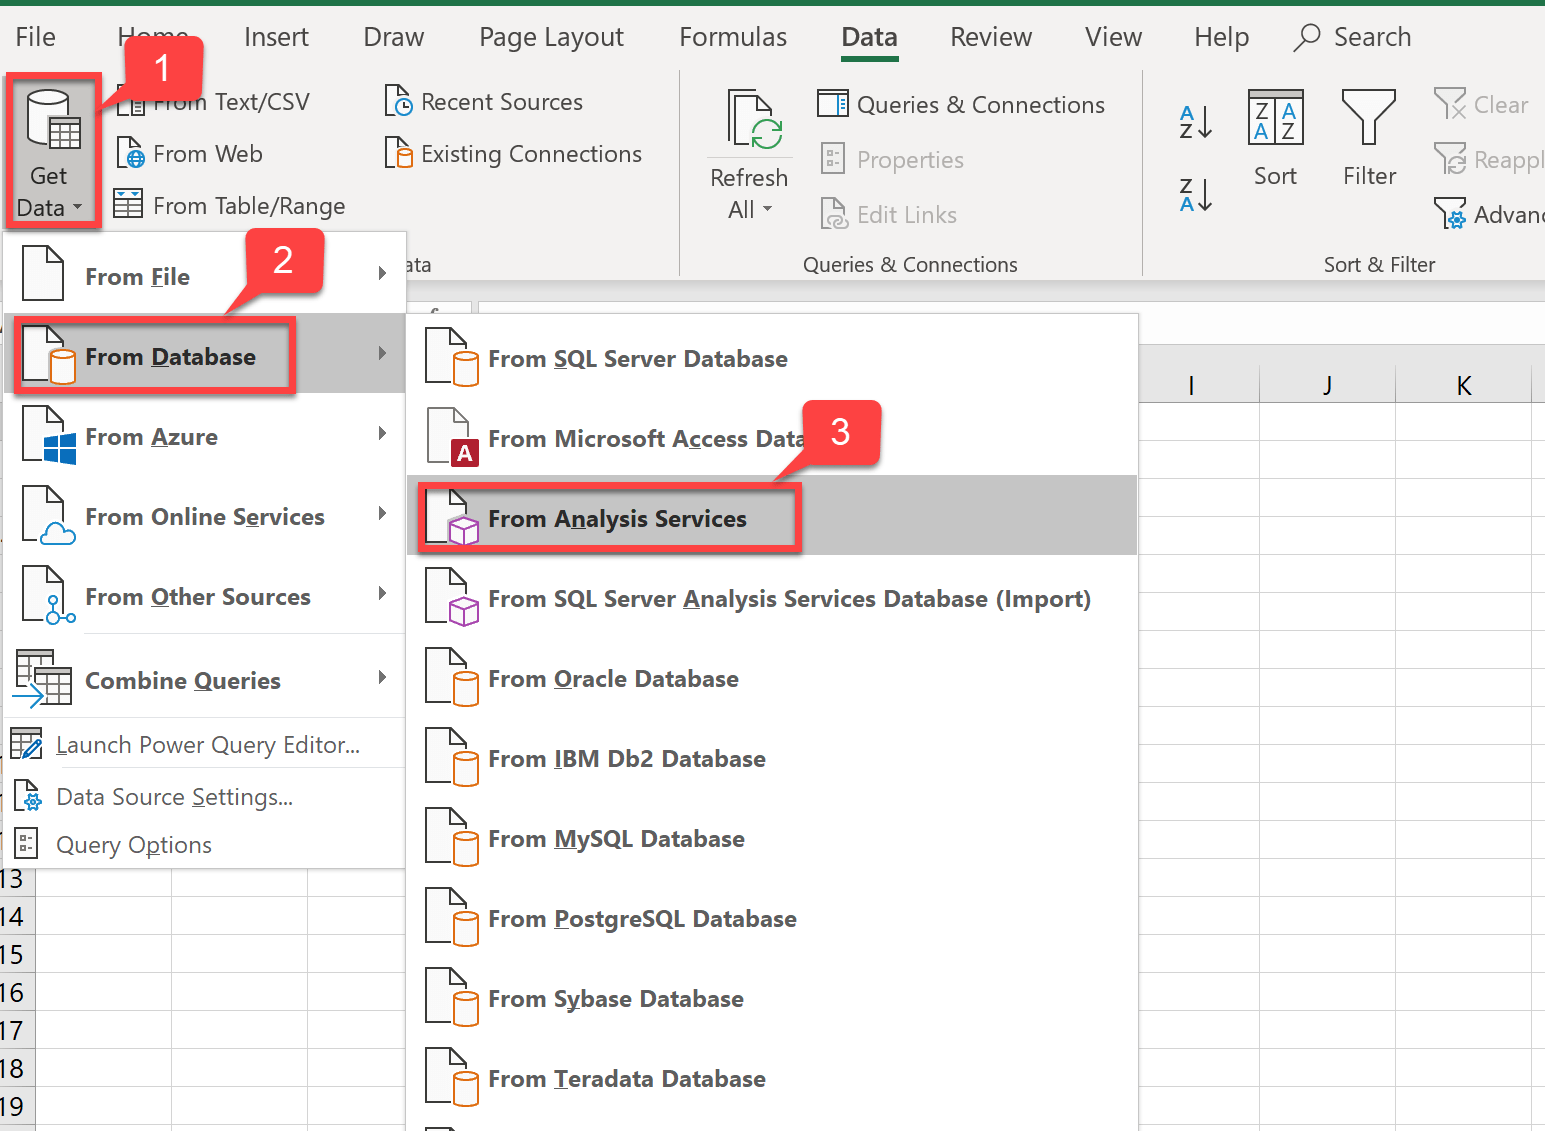
- Navigate to the Data Tab in Excel.
- Select Get Data, From Database and then From Analysis Services.

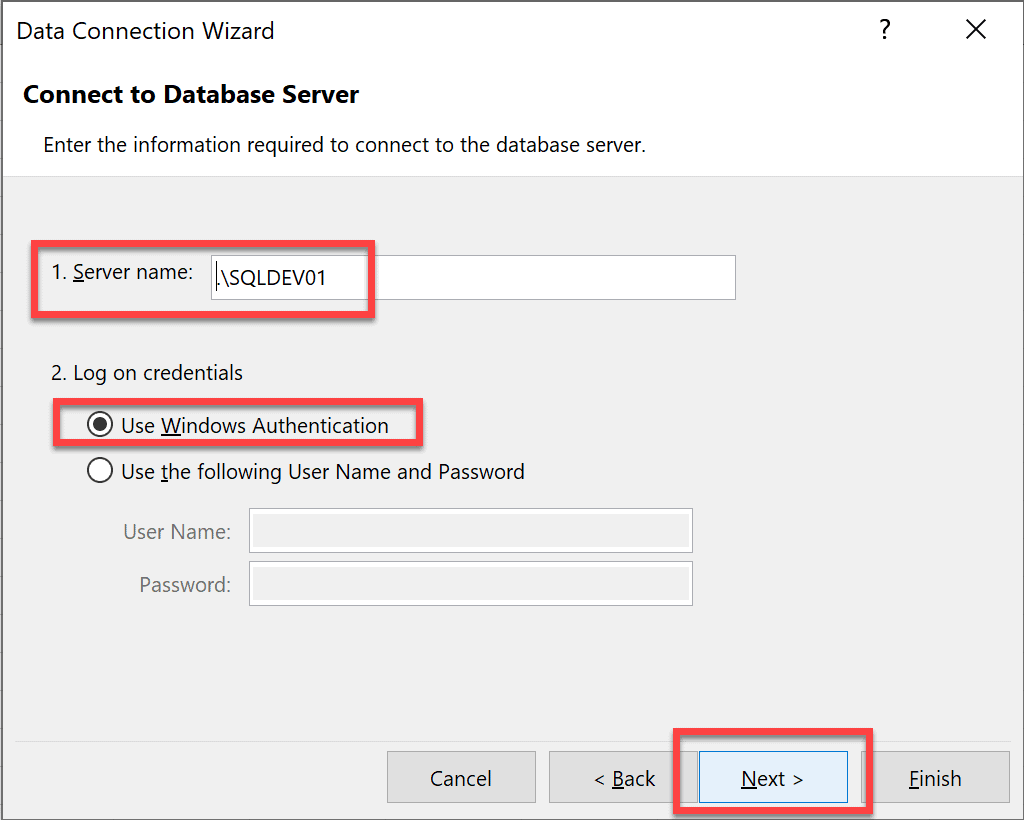
Fig 11 - Get Data in Excel - Provide the Server Name and select Windows Authentication as the login mode. Click Next.

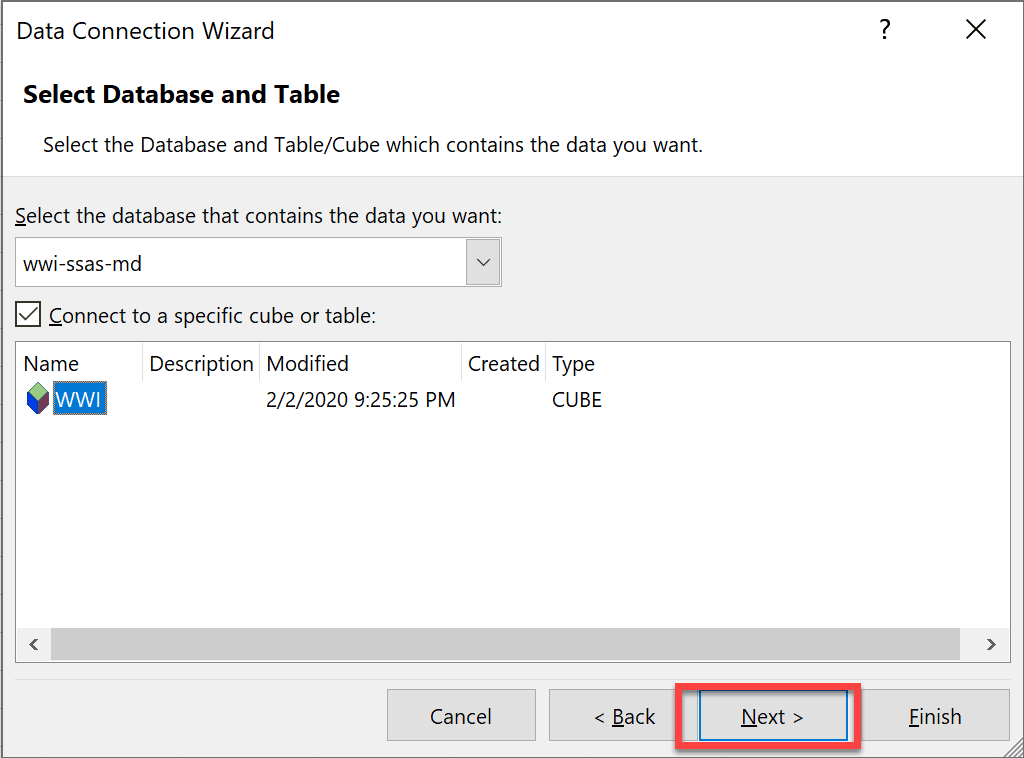
Fig 12 - Data Connection Wizard - Select the desired cube from the dropdown and click Next.

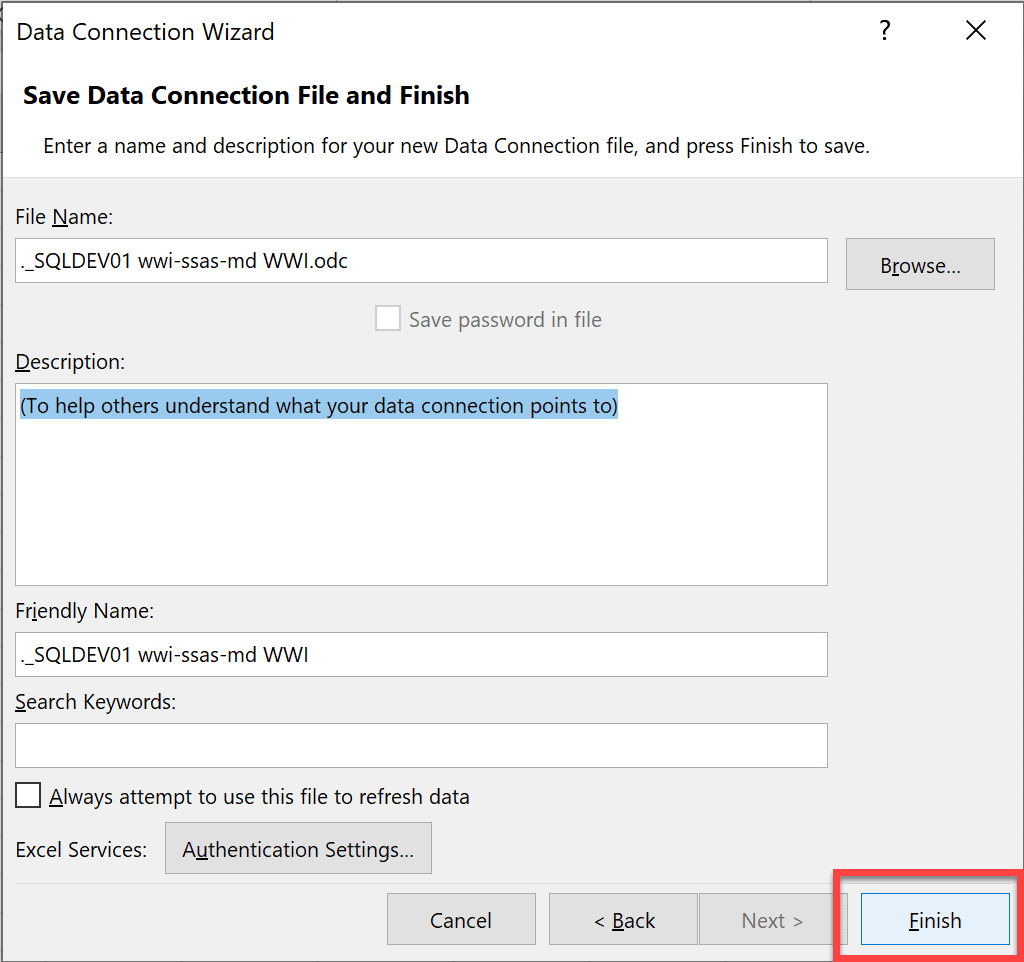
Fig 13 - Select Database and Table - In the next screen, click Finish and import the data into the Excel sheet.

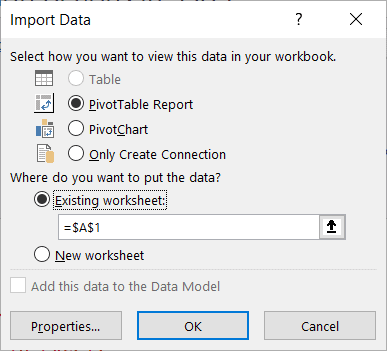
Fig 14 (a) - Save Data Connection - The final step here is to select how would you like to view this data in the Excel workbook. Select PivotTableReport and Existing Worksheet and click OK.

Fig 14 (b) - Select Data View
Now, that we have created the connection in Excel, let us prepare the dataset on which we performed our initial analysis.
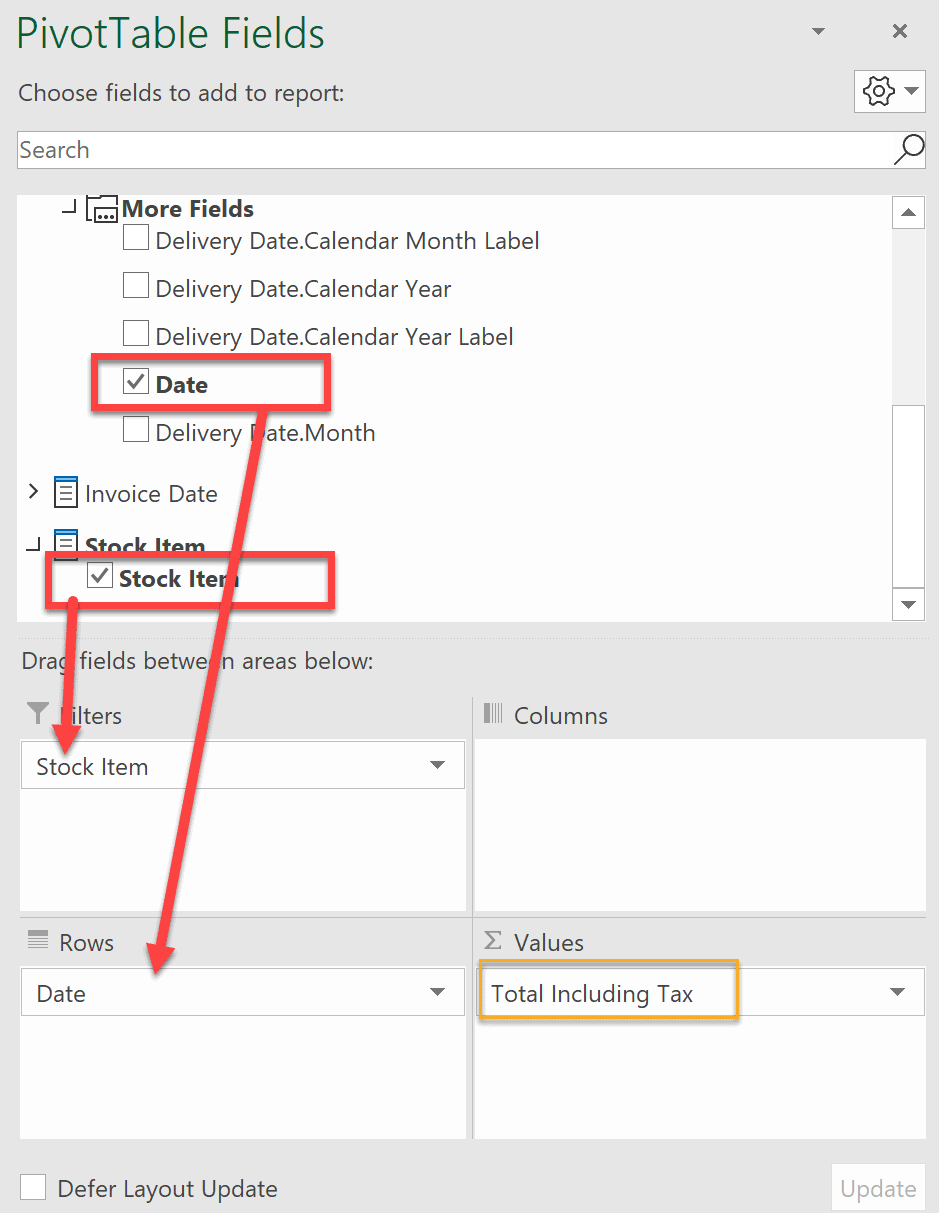
- Drag and drop the fields Stock Item and Date to the Filters and Rows pane respectively.
- Drap and drop the measure Total Including Tax into the Values pane.

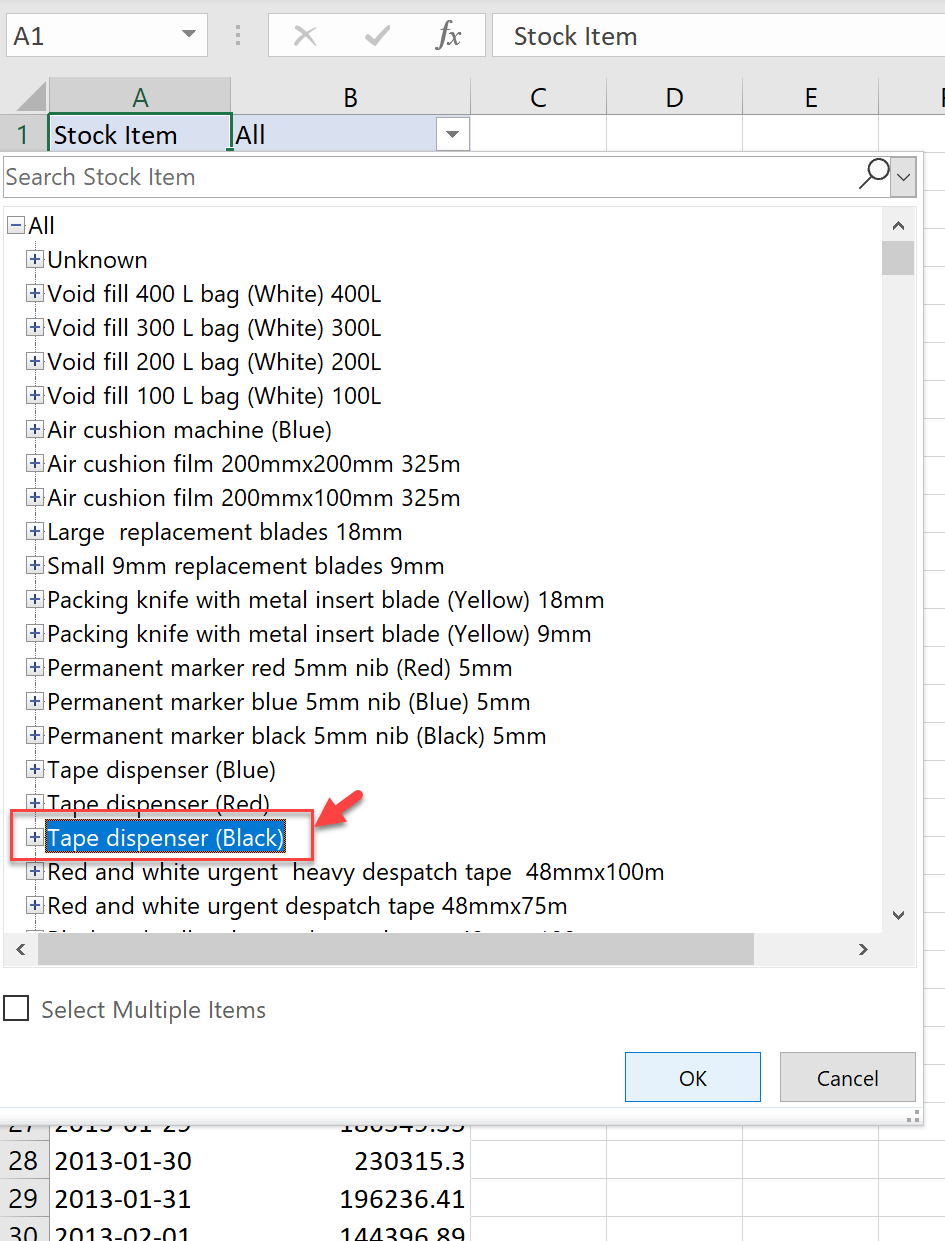
Fig 15 (a) - Drag Drop Dimensions and Measures - Click the filter for Stock Items and select "Tape Dispenser Black".

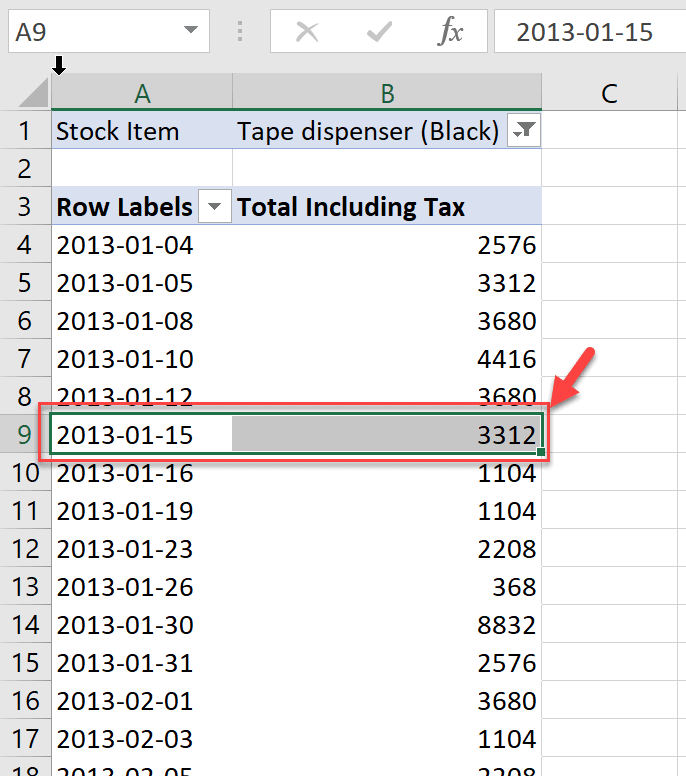
Fig 15 (b) - Filter Stock Item - As you can see, the value for 15-Jan-2013 is 3312.

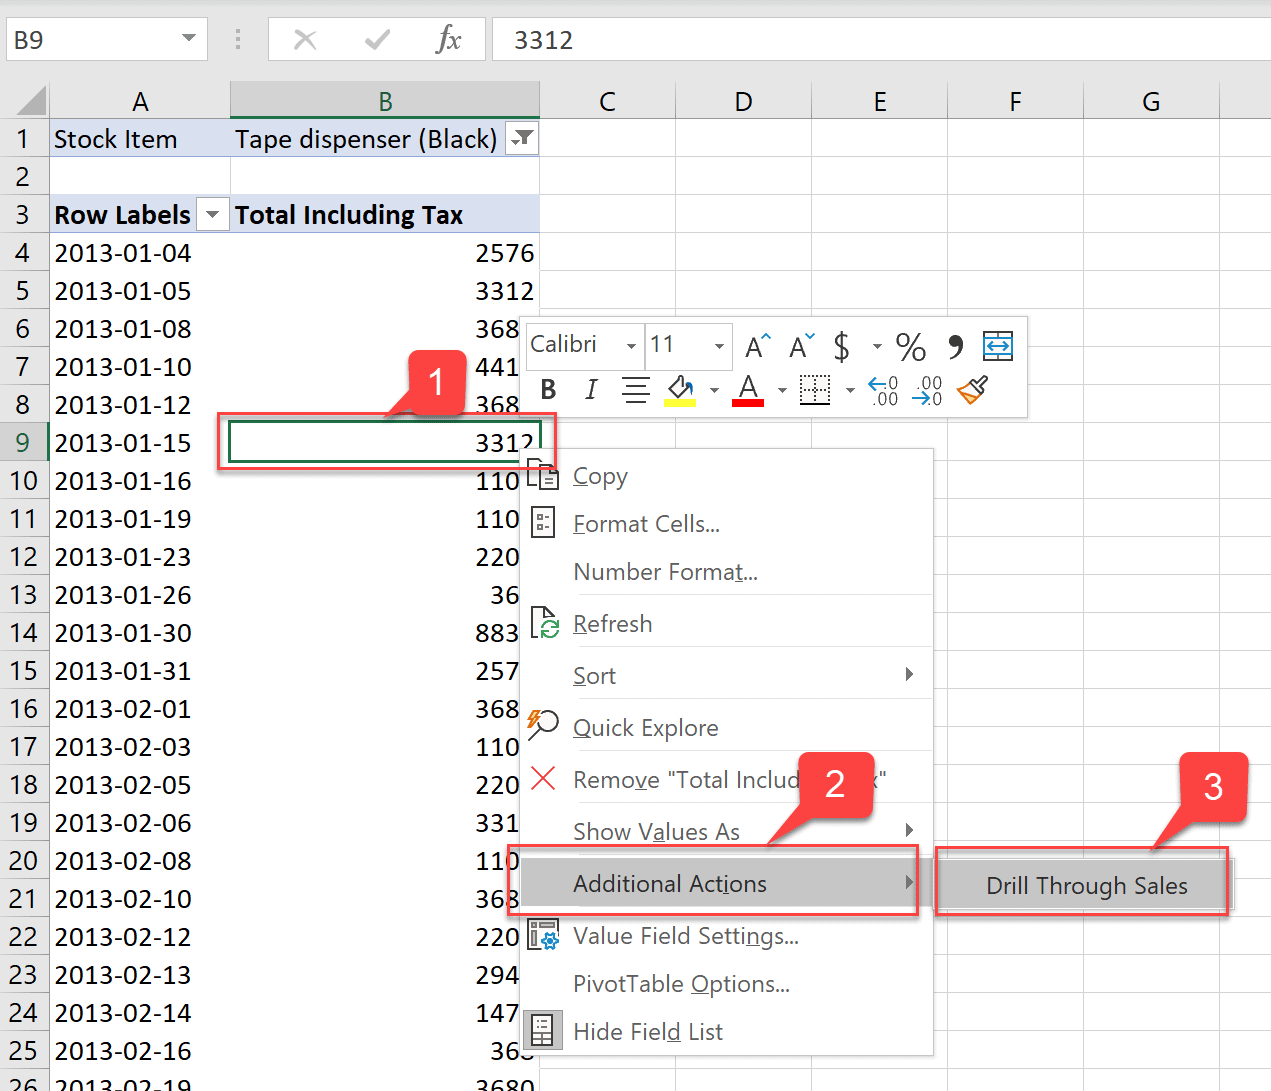
Fig 16 - Stock Item Value - Now, in order to drill through this cell, right-click on it and select Additional Actions and select Drill Through Sales. Notice that the name of the action is the one that we had set while creating the action itself.

Fig 17 - Drill through Sales in Excel - A new sheet opens up with the same information that we had defined in the SSAS Actions designer.
- This data is the same as the one that we fetched using the MDX query in the earlier section of this post.

Fig 18 - Final Resultset
Takeaway
Although summarized information is important, users often need to access the details behind that information in order to correctly understand the information that they’re seeing. In this article, we have seen how to drill through some specific dimensions using MDX and also implementing the same feature in SSAS cubes.


