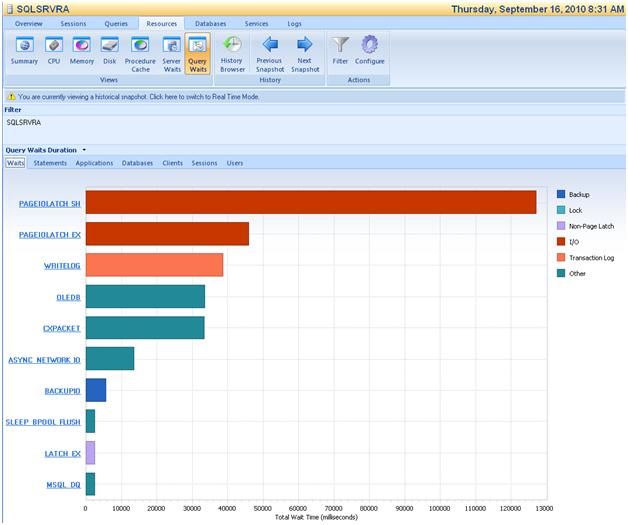
One of the real pleasures of pursuing the database arts is the broad scope of our role in problem management. For a given issue, very often we get to act as a one-stop crime solving lab: From initial crime scene investigation (gathering Profiler traces like so many smeared fingerprints) all the way through a full trial (presenting evidence to executive management for enterprise-wide policy). In this effort, which can be extremely extensive for complex problems, a good arsenal of tools is indispensible. I recently upgraded our Production monitoring environment to Idera’s SQL Diagnostic Manager (SQLdm) 6.2 to get my hands on the new Wait State functionality—and I was so impressed that sharing the results seemed mandatory.
I’ll get the requisite DBA creds out of the way—I’ve been a practicing DBA for just shy of a decade, specializing in the MSSQL platform. I’ve worked my way from a single creaky SQL 2000 instance running a handful of Crystal Reports to hundreds of instances with a full BI stack from multiple vendors. I started as a pure ‘I’ll make my own tools, thanks,’ DBA. Meaning, for the first few years, if I needed monitoring or diagnostic tools, I rolled my own. This worked great for a while—until the scope of my position covered more than a handful of databases—and my SLA’s started requiring 24/7/365. I’ve worked with Quest’s Foglight, RedGate’s SQL Response, and Idera’s SQLdm. All are functional products, with Idera’s being the best fit for the last few years.
So, here’s the situation:
The phone is ringing off the hook. A critical AR application is pausing intermittently throughout the day.
You’ve checked the golden triad. The indexes are more than spotless, they shine. Nary a deadlock is seen. The vast majority of users are experiencing solid performance.
The query cache is clean: No problematic durations are being reported.
If you’re like me, you mentally steel yourself at this point—it’s time to crack open your copy of Davidson’s exceptional Wait States whitepaper (http://technet.microsoft.com/en-us/library/cc966540.aspx) and hit the DMV’s. If you’re lucky, several hours later you’ll have enough data to start charting in Excel. If you’re not—if say, the query in question is ad hoc and not getting a stable query plan cache’d—or the counters require a reset – you’re looking at a day of spreadsheet labor, with just about even money odds of finding the smoking gun.
Then you have the problem of communicating your findings in a legible fashion: ‘Well, it looks like this burst of CXPACKETS follows cleanly from that, unless that SELECT DISTINCT is hung up in a PAGELATCH_IO, which looks like it can happen sometimes due to the DISTINCT, so that the UPDATE over there….’ Developer eyerolls often follow.
After the 6.2 upgrade for SQLdm, I just click on the shiny button and six hours of investigation is done for me:

In the few weeks since production promotion, I’ve been able to solidify several long-suspected performance issues—and present the dev team with clear, legible documentation.
In every case so far, we’ve been able to track the issue down to the offending line of TSQL using just the Idera toolset. No more esoteric DMV queries. No more frantic searches of BOL for the definition of ‘SOS_TRACELOCK’. Even better, the Wait State functionality is included in the out-of-the-box archiving and warehousing functionality, so you can inspect and resolve overnight issues easily.
As SQL DBA’s, we’re lucky. Our core vendor has exposed a wealth of internals for inspection via the DMV layer. However, real time parsing and analysis of that wealth of data—especially for tricky, cross database, multiquery issues—is quite a task, especially on top of our regular duties. Idera did a fine job with this new functionality; to my knowledge, the only product on the market currently with this feature set.
As for the core product, SQLdm is certainly a strong contender in the market, with all the gravy that you’d expect—an archival data warehouse of performance information, configurable baselines, and a variety of canned analytics. I’ve had a few issues with their front-end GUI, which can be a bit unresponsive at times (especially when compared to the responsiveness of SQL Response). However, if you’ve got an environment that’s moved beyond Golden Triad issues, and you’re fighting concurrency it’s the only game in town, so a little sluggishness can be forgiven.

