Introduction to the Problem
When developing Power BI reports, it’s often necessary to slice and interpret datasets in different ways. Using a combination of multiple pages, overlaying visuals and toggling their visibility, setting navigation and actions can become challenging to set up and maintain. However, with the use of Power BI Parameters, this can quickly be overcome.
Using Bookmarks
In my dataset, I have four fields that I would like to slice my data by these fields: Country, Region, Status, and Assignment. To be able to slice by these using bookmarks and actions, I would need to first set up one Power BI report page with visuals set up accordingly, with Country as the dimension. I would then need to capture this page as a bookmark, duplicate the visuals, swap out Country with Region, hide the Country visual, and ensure the Region was visible, then capture a second bookmark.
This would need to be repeated for all four dimensions. Finally, I would need to create some navigation, perhaps by creating my own buttons with actions or by using the built-in Bookmark navigator.
Either way, this would be very time-consuming and involve lots of maintenance, such as toggling visibility, setting bookmarks, or ensuring visuals were lined up perfectly on top of each other.
Using Parameters
Power BI’s introduction of parameters has made this much easier to implement and produces better results for developers and end users.
To get started with parameters, I have connected to SQL Server and pulled in a sample dataset called myTable. When successfully added into Power BI, it looks like this:
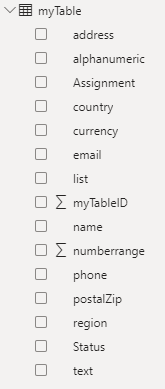
For demonstration purposes, I have added two visuals; a bar chart and a table. These are using the field myTableID to count employees and simply have Country added as a dimension.
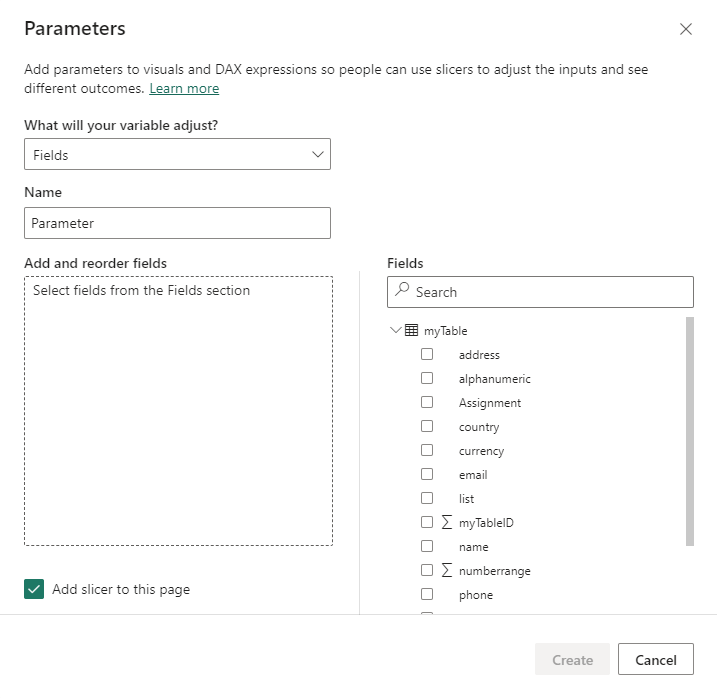
To begin, go to Modelling on the Power BI ribbon and select New parameter > Fields.
Here, the Parameters popup will be displayed. Leave the option "What will your variable adjust?" set to Fields and give your new parameter a name (this isn't important, as the end user will not see this name). For demonstration purposes, I will name this "my_Parameter".
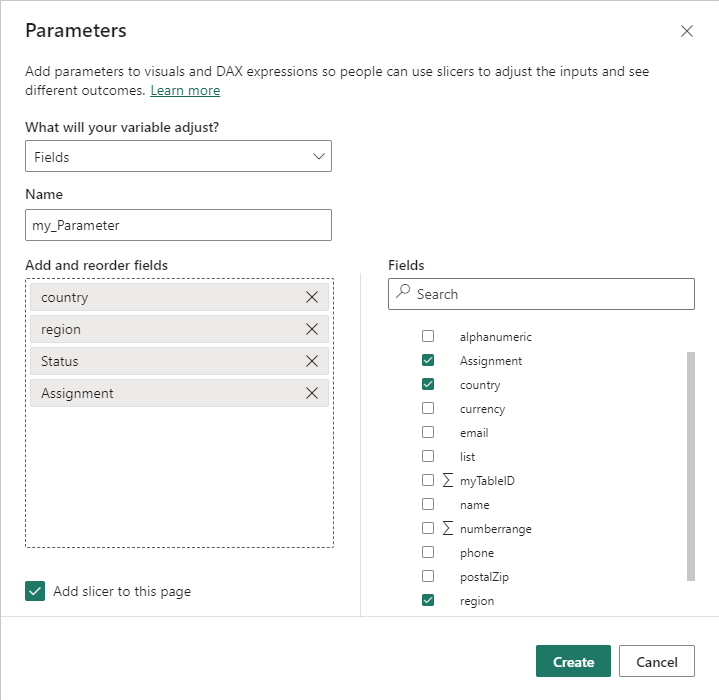
Then, select the fields you would like to include on the parameter slicer and order them accordingly. You can easily reorder them later if required.
In this example, I would like to slice by Country, Region, Status, and Assignment. Previously, this would have resulted in four separate tabs and multiple bookmarking/button actions.
Ensure you have "Add slicer to this page" selected, then click Create.
You will notice that a slicer has been placed on your report, but when toggling these selections, no changes are made. This is the correct functionality, as you now need to make some quick adjustments to activate this parameter slicer.
On each of your visuals (bar chart and table), remove the Country field and replace it with your new parameter (in this case, my_Parameter). You will now see that by toggling this slicer, the two visuals become dynamic (both visuals are controlled simply by the new single slicer).
You can make the slicer visual look more appealing by selecting it and under Visual > Options > Style > Tile, then adjust the width and height accordingly.
You should end up with something like the below:

You can now reduce the number of visuals you need to maintain. The transition is quicker, and you no longer need to duplicate pages, ensure visuals are lined up, or juggle with layers of visuals and bookmarking.
Maintenance of Parameters
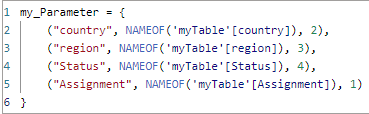
If you wish to add additional fields or reorder your slicer values, you can select your parameter to display its DAX.
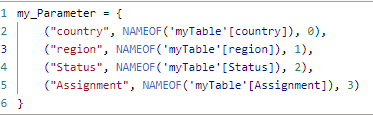
If you want to reorder the fields, you can edit the number at the end of each line. For example, if I want my slicer option to appear in alphabetical order, I can change the sort to this:
Similarly, I can also relabel fields by editing the first part of the string contained within quotation marks.
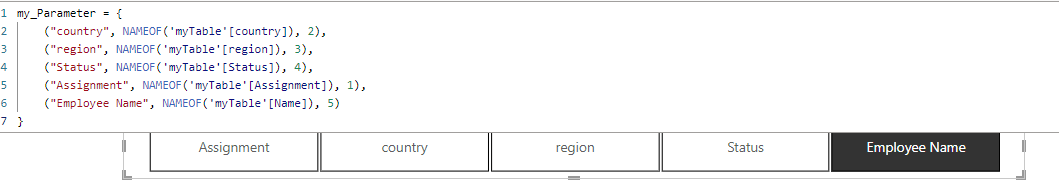
If I wish to include another field for slicing purposes, I simply need to add a new line and define the column. Here, I have added "Name," but changed the label to "Employee Name" (while appreciating that this might not necessarily be a good field to slice by, but this is for demonstration purposes only).
Conclusion
Here, we have demonstrated how Power BI parameters can be used to reduce the need for multiple pages and bookmarking when users require to see the same data sliced in different ways. By using field parameters, we can quickly set up solutions that return results efficiently with very little ongoing maintenance required.