Introduction
In our second case study on dimensional modelling, we delve into the intricacies of managing time-related dimensions, focusing specifically on the "days" dimension. Unlike the date dimension, where each row signifies a specific point in time, the days dimension represents varying lengths of time, each incrementing by one. While the notion of counting days may initially seem like a measure, it takes on a dimensional role when it is banded based on calendar periods, such as months. This transformation allows us to analyze and interpret other measures in a more contextually meaningful manner.
Problem
Within the realm of dimensional modelling, the adaptability of any measure to assume the role of a dimension becomes apparent when it can be effectively grouped or banded to segment other measures for analytical exploration. This concept is exemplified through the examination of surgery wait times, where the duration of wait can vary widely—spanning from days to weeks, and even extending to months or years based on the complexity of the surgical procedure. To facilitate a more nuanced analysis of diverse treatment scenarios for various surgeries, we often employ the practice of banding wait times into intervals, such as 0-10 Days, 10-20 Days, and so forth, or categorizing them into weekly brackets like 0-10 Weeks, 10-20 Weeks.
However, the challenge arises in the potential multitude of bandings required to comprehensively analyze the myriad treatment situations across all types of surgeries. A simplistic approach involving the creation of separate dimension tables for each banding could lead to an abundance of small dimensions, introducing the risk of the "centipede" syndrome in dimensional modelling—where an excessive number of dimensions hinder manageability and performance.
To address this challenge, we explore the possibility of denormalizing all the days bandings into a single dimension table, akin to our approach with the Age dimension in a previous case study. This investigation seeks to determine the feasibility and benefits of consolidating various bands of wait times into a unified dimension, streamlining the modeling process and mitigating the potential drawbacks associated with an overly fragmented dimensional schema.
Solution
Building upon the concept of our age dimension case study, where we enriched the age dimension with age group columns, we propose the creation of a Days Dimension (DimDays). By extending a tally table, with each row representing the number of days, we establish the foundation for our Days Dimension.
Why call it the Days Dimension instead of a more generic name? Following Kimball's guidelines, we name dimension tables based on their grain. Although this table will serve various time bands, we stick to the grain of days for clarity.
Our DimDays table will cover a generous range from 0 days to a maximum of 5 years, totaling 1826 rows. By incorporating additional columns holding banded values in days, weeks, months, and years, this simple tally table transforms into a versatile dimension table, enabling meaningful slice-and-dice analysis of relevant measures.
Banding Examples
Assuming we want to band in days, weeks, months, and years, we define increments as follows:
- Days (up to 30 days with an increment of 10):
- 0-10 Days
- 10-20 Days
- 20-30 Days
- 30+ Days
- Weeks (up to 20 weeks with an increment of 4):
- 0-4 Weeks
- 4-8 Weeks
- 8-12 Weeks
- 12-16 Weeks
- 16-20 Weeks
- 20+ Weeks
- Months (up to 2 years with an increment of 3):
- 0-3 Months
- 3-6 Months
- 6-9 Months
- 9-12 Months
- 12-15 Months
- 15-18 Months
- 18-21 Months
- 21-24 Months
- 24+ Months
- Years (up to 5 years with an increment of 1):
- 0-1 Years
- 1-2 Years
- 2-3 Years
- 3-4 Years
- 4-5 Years
- 5+ Years
Implementation
Utilizing T-SQL, we will load our DimDays table, demonstrating a practical example for a comprehensive understanding. This script generates a tally table using a recursive common table expression (CTE) and then calculates bands based on hardcoded increments. The final SELECT statement generates bands for days, weeks, months, and years, handling edge cases when the maximum value exceeds predefined limits.
-- Declare variables for banding maximums
declare @MaxDay int=30
declare @MaxWeek int=20
declare @MaxMonth int=24
declare @MaxYear int=5
declare @MaxDays int=@MaxYear*365
-- Recursive CTE to generate a tally table representing the number of days
;with tally as
(
    SELECT
        Days=0
    UNION ALL
    SELECT
        Days+1
    FROM tally
    WHERE Days<@MaxDays
)
-- CTE to calculate bandings based on increments
, Band as (
select Days
  ,Day10=10*(Days/10)
  ,Day10Max=10*(Days/10)+10
  ,Week4=4*(Days/28)
  ,Week4Max=4*(Days/28)+4
  ,Month3=3*(Days/90)
  ,Month3Max=3*(Days/90)+3
  ,Year1=Days/365
  ,Year1Max=Days/365+1
from tally
)
-- Final SELECT statement to generate bands and handle edge cases
select Days
,Day10Band=case when Day10Max<=@MaxDay then concat(Day10,'-',Day10Max,' Days')  else concat(@MaxDay,'+ Days') end
,Week4Band=case when Week4Max<=@MaxWeek then concat(Week4,'-',Week4Max,' Weeks') else concat(@MaxWeek,'+ Weeks') end
,Month3Band=case when Month3Max<=@MaxMonth then concat(Month3,'-',Month3Max, ' Months')  else concat(@MaxMonth,'+ Months') end
,YearBand=case when Year1Max<=@MaxYear then concat(Year1,'-',Year1Max, ' Years')  else concat(@MaxYear,'+ Years') end
from Band OPTION (MAXRECURSION 4000)
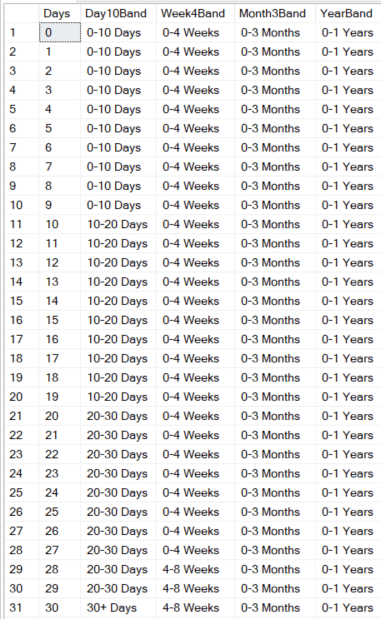
The script will generate results comprising the initial 31 rows, as illustrated below. Notably, the columns are labeled according to the increment number: Day10Band, Week4Band, Month3Band, YearBand. It is worth emphasizing that we have the flexibility to adopt any meaningful naming convention, aligning with specific bandings, as we incorporate them into the table.

By adopting this approach, we ensure a seamless integration of the Days Dimension into our dimensional model, enhancing the depth and scope of our analytical capabilities.


