Have you ever wanted to build your own performance dashboard? This article will take you through the steps required to build a simple Excel-based monitoring solution to watch your CPU usage, SQL Server scheduler configuration, workloads and worker thread activity. At its core are filtered queries on the Dynamic Management Objects / Views (DMOs / DMVs) sys.dm_os_schedulers, sys.dm_os_sys_info and sys.dm_os_ring_buffers, and these are combined into meaningful information through the use of stored procedures, Excel graph functionality and data refresh capabilities.
This article is aimed at users of SQL Server 2005 and above. The techniques have been tested using SQL Server 2005 Standard Edition and 2012 Developer Edition, but will work equally well with SQL Server 2008 (indeed, you will probably be able to improve upon it with new features). I would also like to add that this article is fixed in scope to CPU performance, workers and schedulers. You will be able to add more functionality such as memory use monitoring, I/O performance and more. To this end I heartily recommend Microsoft's SQL Server 2008 Internals and Wrox's SQL Server 2008 Internals & Troubleshooting, which have a place of pride on my shelves.
Firstly, a brief introduction for those new to the inner workings of task assignment in SQL Server. It is beyond the scope of this article to go into much depth about the internal plumbing of processor task assignment; there are other sources for this. However I hope to give a simplified overview with as few mistakes as possible.
Imagine you have a production server with 8 physical processors. The server is a dedicated box, i.e. the primary and only purpose of the server is to house SQL Server. The architecture is 64-bit on Windows Server 2003/2008 with SQL Server 2005 / 2008 Standard or Enterprise (or indeed Developer) Edition. On your server, under the default settings (no affinity mask set i.e. dynamic mapping of schedulers to processors) you will normally find one scheduler per processor. It is important to note that unless you specify an affinity mask, there is no automatic one-to-one assignment of schedulers to processors, however often the workload may appear that way. Tasks can be assigned to other workers on different schedulers, there is a detailed and complex flow of movement at this layer.
An affinity mask is a binary value representative of the state of each processor as it relates to SQL Server – in essence, whether the processor is 'turned on' or 'turned off'. Having processors unavailable for SQL Server to use may be beneficial in some circumstances, i.e. if you are using the production database server as a web application or Sharepoint server (please don't do this!).
Processors 0 – 7 on an eight-way server can correspond to a one-byte binary value like 00000000 where each digit of the value references a single processor. Hence, 11111111 (decimal value: 255) means all processors are used for SQL Server. 00100100 (decimal value: 36) means processors 2 and 5 are in use. Affinity masks can come in one, two, three and four-byte forms and in addition, for 64-bit systems with more than 32 CPUs, a secondary 'Affinity64' mask can be configured to complement the first mask and extend the range of values.
Below is a simplified diagram of how schedulers map to processors using an affinity mask, and a simplified view of tasks being assigned to workers, which are assigned to schedulers, which are mapped to processors:
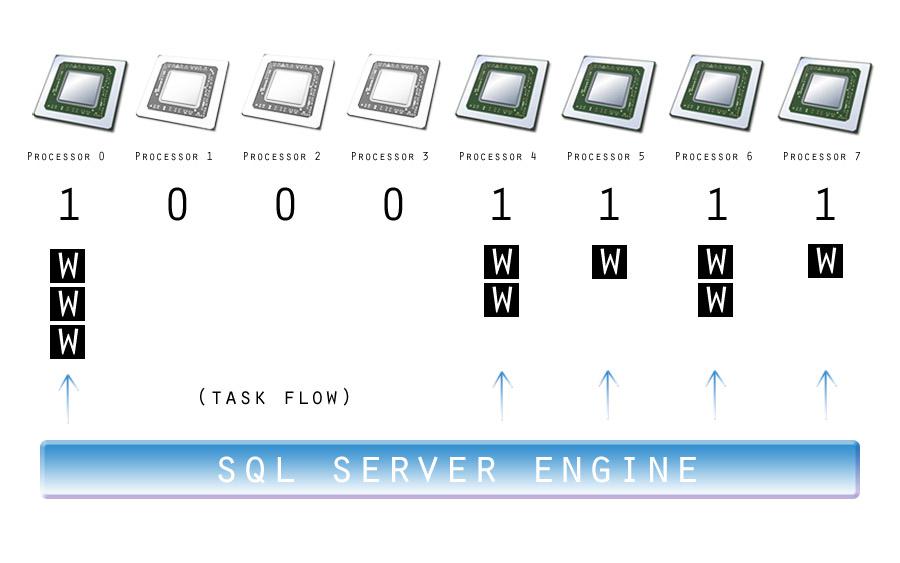
(Thanks to www.wpclipart.com for the gratis CPU component artwork)
With the basics covered, we can now look at why we would want to monitor the processor use. After all, with today's multi-core, multi-processor systems, surely high CPU loads are a thing of the past? With today's NUMA architecture providing extra memory bus capabilities and super-fast, high-efficiency cores, processing bugbears are the least of your worries. Right?
Sadly, wrong. As businesses demand more and more from their applications, the corresponding tasks that the database layer has to complete get larger too. In the era of big data (or should that be Big Data?) it is not unusual to find multi-terabyte databases. Microsoft have 100TB+ databases on record for some of their biggest clients (see the Case Studies section on the Microsoft site). Imagine computing sums or products of thousands of data points across a meticulously-arranged cube that's based on a terabyte database or consider how many transactions a site like Amazon gets through every second of every day, and how compute-intensive that will be. CPU time can still be maxed out in any architecture. The effects on SQL Server can be disastrous – under high load, inbound connections can be refused and queries can time out or stall with unintended consequences.
It's not just the processor use. The schedulers normally are assigned a roughly-equal number of workers. The workers themselves are spawned and destroyed by SQL Server, with each processor allocating and yielding processor time on the fly. SQL Server normally does an excellent job of dynamically managing the processor time per scheduler/worker (known as a 'quantum'). However, factors like MAXDOP (Maximum Degree of Parallelism), badly-configured settings (Cost Threshold for Parallelism set too low/high), uneven query batches being incorrectly split, good old-fashioned high demand and even impending hardware failure (silicon degradation, for example) can cause an uneven distribution of tasks to worker threads. It's important to spot this early, so we can:
- Spot high processor demand in near-real-time and take measures to prevent problems
- Instantly 'eyeball' the data and see if the values are extreme given the processor use history
- Spot patterns of activity where parallelism is not working efficiently
Using CPU and scheduler metrics should be part of an extensive toolkit and this is not a catch-all solution. However when used in conjunction with the DMVs, your other component tools, monitoring, notifications, alerts etc., this will help you to get a handle on a situation or diagnose a potential problem before it becomes a real one.
To business. Firstly, you will need a copy of Excel. I'm using Office 2010, so the screenshots and descriptions I use you may need to amend for earlier versions or for the open-source equivalents. Secondly, you'll need a clear path from the machine you're using Excel on (perhaps your local workstation) to the server. You may need to open firewall ports to allow this to happen. You'll also need an account with appropriate permissions (public, CONNECT, VIEW SERVER STATE, and preferably DB_OWNER on a diagnostic or sandbox database).
Step 1: Set up the data objects
Issue the following query to find out how many schedulers you have on your target server.
SELECT COUNT(*)
 FROM sys.dm_os_schedulers
 WHERE scheduler_id < 255
-- (ids >=255 are for the DAC or other internal use)
This should correspond to the number of processors you have on your server. Note that if you're using hyperthreading, you'll normally have one scheduler per logical processor, rather than physical.
Now check if you're using an affinity mask. By default, you will not. You can find out by querying sys.configurations. To do this, you'll need to turn on 'show advanced options' first and have the VIEW SERVER STATE permission. Value will be 0 if the affinity mask is unused, otherwise it will be a decimal value corresponding to the binary representation of the processor use mapping, as explained above:
EXEC sp_configure 'show advanced options', 1
RECONFIGURE WITH OVERRIDE
GO
SELECT [value]
 from sys.configurations
 WHERE [name] = 'affinity I/O mask'
GO
On your diagnostic database (I will refer to this as SANDBOX from here on out), create the following tables. These will act as repositories for the data you collect:
-- Create one 'Scheduler_N' table for each scheduler / processor, starting from 0. -- i.e. if you have two processors, create two tables called Scheduler_0 and

-- Scheduler_1.
CREATE TABLE [dbo].[Scheduler_N] (
[UID] [bigint] IDENTITY(1 ,1) NOT NULL,
[timestamp] [datetime] NOT NULL,
[is_idle] [bit] NOT NULL,
[current_tasks_count] [bigint] NOT NULL,
[runnable_tasks_count] [bigint] NOT NULL,
[current_workers_count] [bigint] NOT NULL,
[active_workers_count] [bigint] NOT NULL,
[work_queue_count] [bigint] NOT NULL,
[load_factor] [bigint] NOT NULL
)

-- This next table will hold general processor usage data:
CREATE TABLE SANDBOX.dbo .OverallProcessorUsage (
 EventTime DATETIME,
 SQLProcessUtilization INT,
 SystemIdle INT,
 OtherProcessUtilization INT
)
Now create your procedures. The first procedure collates the data we'll be needing into the first set of tables. Below is an example where you are configuring the procedure for four processors – feel free to amend this to suit your architecture. Note the bitwise switches will be explicitly set to 0 only if you are using an affinity mask and the processor is disabled for SQL Server use.
CREATE PROCEDURE [dbo].[GetSchedulerData] (
 @s0 BIT = 1,
 @s1 BIT = 1 -- add more here if necessary
)

AS BEGIN

IF @s0 = 1
 BEGIN
  INSERT INTO SANDBOX.dbo.Scheduler_0
   SELECT GETDATE(),
          sch.is_idle,
          sch .current_tasks_count, sch.runnable_tasks_count,
          sch .current_workers_count, sch.active_workers_count,
          sch .work_queue_count,
          sch.load_factor
    FROM sys.dm_os_schedulers sch
    WHERE sch. scheduler_id = 0
 END

IF @s1 = 1
 BEGIN
  INSERT INTO SANDBOX.dbo.Scheduler_1
   SELECT GETDATE(),
          sch.is_idle,
          sch.current_tasks_count, sch.runnable_tasks_count,
          sch.current_workers_count,
          sch.active_workers_count,
          sch.work_queue_count, sch.load_factor
    FROM sys.dm_os_schedulers sch
    WHERE sch. scheduler_id = 1

 END

-- continue if necessary
END
The following procedure was written by Ben Nevarez – I can take no credit. It uses the largely undocumented DMV sys.dm_os_ring_buffers combined with the CPU ticks column of sys.dm_os_sys_info to correlate CPU use and divide it into idle, SQL Server use, and non-SQL Server use. You can find the full article here: http://sqlblog.com/blogs/ben_nevarez/archive/2009/07/26/getting-cpu-utilization-data-from-sql-server.aspx
I've modified it slightly to insert the results into the table we made earlier:
CREATE PROCEDURE dbo.GetProcessorUsage
AS
BEGIN
 -- Courtesy of Ben Nevarez

DECLARE @ts_now bigint

SELECT @ts_now = cpu_ticks / CONVERT(FLOAT,cpu_ticks_in_ms) FROM sys.dm_os_sys_info

INSERT INTO SANDBOX.dbo .OverallProcessorUsage
 SELECT TOP 1
    dateadd(ms, -1 * (@ts_now - [timestamp]), GETDATE()) AS EventTime,
    SQLProcessUtilization,
    SystemIdle,
    100 - SystemIdle - SQLProcessUtilization AS OtherProcessUtilization
  FROM (
         SELECT
           record.value( '(./Record/@id)[1]', 'int') AS record_id,
           record.value( '(./Record/SchedulerMonitorEvent/SystemHealth/SystemIdle) [1]','int' ) AS SystemIdle,
           record.value( '(./Record/SchedulerMonitorEvent/SystemHealth/
           ProcessUtilization)[1]' , 'int' ) AS SQLProcessUtilization,
           timestamp

         FROM (
           SELECT timestamp , convert (xml, record) as record
             FROM sys.dm_os_ring_buffers
             WHERE ring_buffer_type = N'RING_BUFFER_SCHEDULER_MONITOR'
             AND record LIKE '%<SystemHealth>%') AS x
          ) AS y
       ORDER BY record_id DESC
END
Now you'll need to create a login and database user for Excel to use. Alternatively you can use an existing login you've already configured.
CREATE LOGIN excel_login WITH PASSWORD = 'In5p3cT0Rg4DG3t';
GO
EXEC sp_addsrvrolemember
   @rolename = 'db_owner',
   @loginame='excel_login';
GO
USE SANDBOX
GO
CREATE USER excel_user FROM LOGIN excel_login;
GO
GRANT EXECUTE on dbo.GetSchedulerData TO excel_user;
GRANT EXECUTE on dbo.OverallProcessorUsage TO excel_user;

-- You may wish to:
EXEC sp_addrolemember
   @rolename = 'db_owner',
   @membername = 'excel_user';
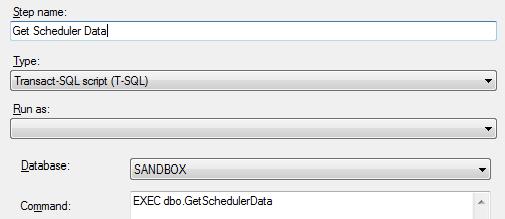
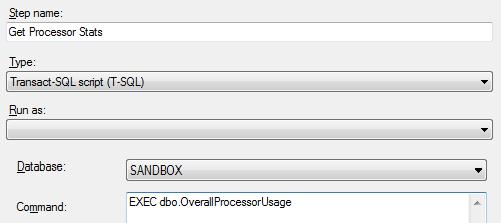
Finally, we need to set up a job to collect all the stats. Use SQL Server Agent to create a new job. Schedule it weekly, with all days ticked, executing every 1 minute. The screenshots below, using SSMS, should illuminate this procedure. There should be 2 job steps. The first will populate the Scheduler_N tables
The second populates the processor use table.
The schedule is shown below
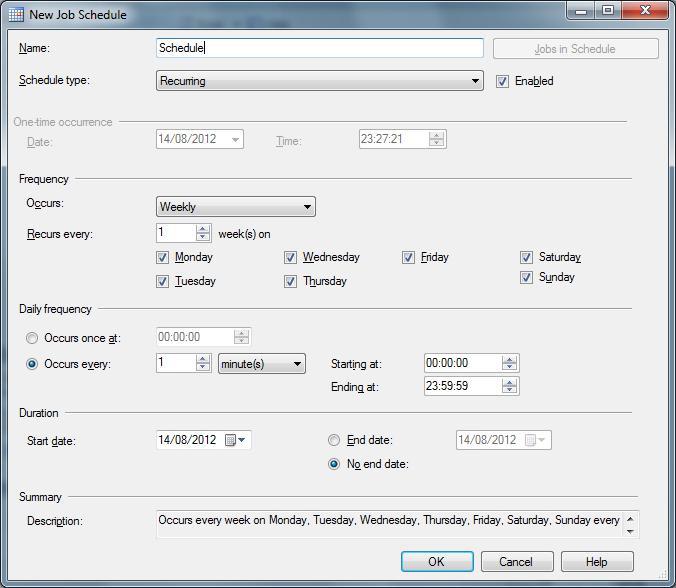
Note that in SQL Server 2012, you can schedule with a granularity to the second, but in previous versions the smallest unit of time for the purposes of scheduling is a minute, hence the schedule suggested above. Feel free to modify to suit your purposes.
That's all we need to do SQL Server-side. Make sure your jobs are running by querying the Scheduler_N tables you created – a new row should be added every minute, or according to your modified schedule.
We now need to set up our Excel workbook.
Step 2: Set up the Excel workbook
Now let's set up the workbook
- Open Microsoft Excel 2010, and create a new blank workbook.
- Click on the Data tab, and click From Other Sources on the Import sub-tab.
- On the drop-down menu, click From SQL Server...
- Now in the resulting box, type the address of the server. If it's local, you can use the TCP loopback interface 127.0.0.1,1433 (where 1433 is your port) providing that a) you are using the default port, b) TCP/IP is enabled on your server (by default, yes). You can also use (local) or localhost if you're running the SQL Browser service. If not, put in the IP address and port of the server in question.
- Next, select the database from the drop-down menu. This will form your data connection. We are using SANDBOX, so I'll select SANDBOX from the menu and click Next.
- In the subsequent window, I'll select the table I want to query data from. For this sheet, I will select dbo.Scheduler_0. Click Finish.
You will now see that the data has been pulled from the table directly into the spreadsheet.
- Repeat Steps 1-6 on a new sheet each time for each scheduler you are collecting data on, selecting each of your dbo.Scheduler_N tables in turn. When you are finished, you will have N sheets with the scheduler data on, partitioned (by sheet) by scheduler. On the data tab, click Refresh then Refresh All... to pull fresh data from the database into your sheets. You will find extra rows added onto all sheets automatically.
- Once you're done importing scheduler data, create a new worksheet in the workbook and import the contents of dbo.OverallProcessorUsage using the same method as in the steps above. Then highlight the timestamp, SQLProcessUtilization and OtherProcessUtilization columns for all values present and create a new line graph. You will need to play with the formatting a little – here, I have the x axis labels turned off, and the graph custom-sized to fit on the same sheet as the source data. NOTE: I have noticed in Office 2010 that if you select the entire column(s) as source data, the graph becomes unreadable, as all blank values are counted. Only select the block of data containing the columns and rows you want. As the workbook is refreshed, the data source for the graph will continually update – you will not have to do this manually).
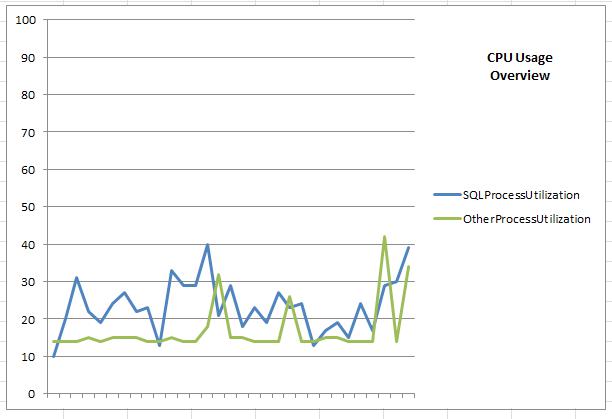
- Now create another new sheet, called Stats. On this page will be a general summary of the stats collected, together with the granular chart data per scheduler.
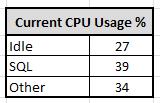
These values are linked to the latest value for the associated columns in the processor usage sheet. Simply select the data source as the last value of the relevant column. These values will update automatically on refresh.

Times and dates in the figure above indicate the range of data. They come from the MIN and MAX values of the timestamp column in any of the scheduler sheets. Format the cells for DATE and TIME respectively to show the component parts.
Duration is simply a function of MAX - MIN time, measured in HH:MM:SS

Current Idle Schedulers: Calculated as N-(LN+LN+1+LN+2 ... LN+N) where N is number of schedulers and LN is latest idle value (Boolean). E.g. for 8 schedulers where the current row (latest row) on each scheduler sheet is 114, the formula is:
=8-(Scheduler0!C114+Scheduler1!C114+Scheduler2!C114+Scheduler3!C114+Scheduler4!C114+Scheduler5!C114+Scheduler6!C114+Scheduler7!C114)
Total Current Tasks: Calculated as the sum of the current tasks for each scheduler on each sheet. Example formula:
=Scheduler0!D114+Scheduler1!D114+Scheduler2!D114+Scheduler3!D114+Scheduler4!D114+Scheduler5!D114+Scheduler6!D114+Scheduler7!D114
Total Runnable Tasks: Calculated as the sum of the current runnable tasks for each scheduler on each sheet. Example:
=Scheduler0!E114+Scheduler1!E114+Scheduler2!E114+Scheduler3!E114+Scheduler4!E114+Scheduler5!E114+Scheduler6!E114+Scheduler7!E114
(Note: Because of the very low window where each task becomes runnable, i.e. the high relative proportion of time it spends not runnable, this counter will rarely increment).
Total Current Workers: Calculated as the sum of the current workers for each scheduler on each sheet. Example:
=Scheduler0!F114+Scheduler1!F114+Scheduler2!F114+Scheduler3!F114+Scheduler4!F114+Scheduler5!F114+Scheduler6!F114+Scheduler7!F114
Total Active Workers: Calculated as the sum of the active workers for each scheduler on each sheet. Example:
=Scheduler0!F114+Scheduler1!F114+Scheduler2!F114+Scheduler3!F114+Scheduler4!F114+Scheduler5!F114+Scheduler6!F114+Scheduler7!F114
(Note: active workers should always be lower than current workers. Current workers is limited by default to 576, visible in sys.configurations. This figure can be overridden up to a maximum of 32,768 workers on a 64-bit system. Default dynamic.)
Average Load Factor: Calculated as the unweighted average of the current load factors for each scheduler, rounded to 1 decimal place. Example:
=ROUND(AVERAGE(Scheduler0!I114,Scheduler1!I114,Scheduler2!I114,Scheduler3!I114,Scheduler4!I114,Scheduler5!I114,Scheduler6!I114,Scheduler7!I114),1)
Total Work Queue: Calculated as the sum of the current work queues for each scheduler on each sheet. Example:
=Scheduler0!H114+Scheduler1!H114+Scheduler2!H114+Scheduler3!H114+Scheduler4!H114+Scheduler5!H114+Scheduler6!H114+Scheduler7!H114
Affinity Mask: Uncalculated value indicating whether an affinity mask on the processors (and corresponding AffinityMask64) has been set, or whether it is not used.
On the same sheet:

Put one graph for each scheduler. Each graph is a simple line chart against the columns in each dbo.Scheduler_N sheet, although some formatting is required.
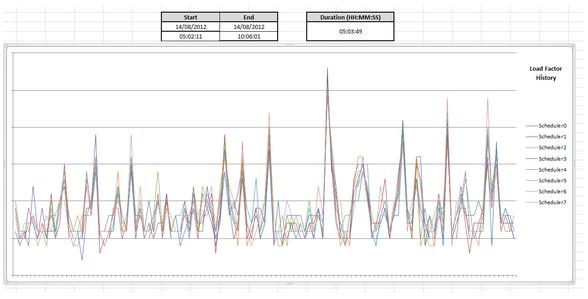
Finally, create one more sheet called Load Pattern and add multiple data series to it – one data series for each Load_Factor column in your dbo.Scheduler_N sheets. You will have one series per scheduler/processor.
The graph is a collection of the series of each Load Factor in each Scheduler_N sheet. Ensure you specify the exact columns and rows and not a blanket column i.e. J:J otherwise the graph will not display correctly. The data (and graph) will update on each data refresh.
Below is an example of the sheet. I have added in the duration and range again for easy reference when viewing the sheet.
You should now have a working CPU performance dashboard – congratulations! To refresh the data, either use a macro to do this, or call the refresh directly (AddRefresh method? Untested.) and call it from a Timer component using VB.NET in Excel. I prefer to update my workbook manually with a keyboard shortcut – one press, and everything updates, giving me a near-real-time human-friendly view into what my schedulers are doing.
I hope you enjoyed reading this and that some/all of it comes in useful to you. Please feel free to make comments / corrections and suggestions on this article, I'll endeavor to respond as soon as I can.


