I am often asked to produce presentations containing data from database tables and views. Over the years I have developed two utilities that are indispensable time-savers:
- a SQL-Server stored procedure that generates table/view column names, and
- an Excel macro that colors alternating sets of rows based upon their "business key" values.
Emit a row full of column names
Excel is a great tool for formatting data that you've extracted from tables or views. You can copy such data into an Excel spreadsheet straight from SQL Management Studio's output grid. For years I didn't realize that there's an option to make SQL Management Studio also grab the column headers (see "Include Column Headers from SMSS"), so I created a stored procedure that would do this. The procedure remains useful if you don't want to have the SMSS "column headers" option turned on all the time, and it is also an interesting example of what you can do with SQL Server's schema - describing metadata.
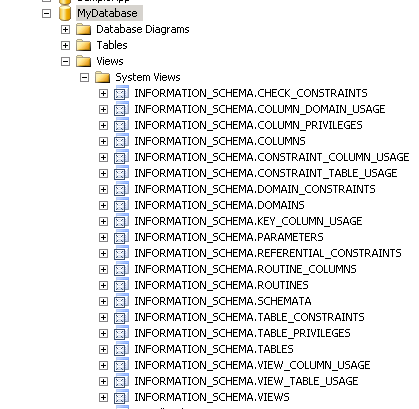
Starting with SQL Server 2005, Microsoft implemented a set of ANSI-standard views that can help solve problems like this one. Using SQL Management Studio you can see them in every database under the "System Views" folder:
These views provide a simple, intuitive look into the schema of your database. In particular, INFORMATION_SCHEMA.COLUMNS provides a column-by-column listing of many interesting properties of each column in every user-defined table and view. Using just three of the columns in this view, you can query all of the column names in all of your tables and views, with the column names listed in declaration order:
select
        TABLE_NAME,
        COLUMN_NAME
from INFORMATION_SCHEMA.COLUMNS
order by
        TABLE_NAME,
        ORDINAL_POSITION
We can use this query to build a stored procedure which, given the name of a table or view, returns a single row having the same schema as the passed-in table or view, in which each column contains its own name. The procedure uses a cursor that steps through the rows of the output of the above query, constructing a command by tacking on one column name with each iteration:
if object_id('ColumnHeaders', 'P') is not null drop procedure ColumnHeaders
go
create procedure ColumnHeaders
        @TableName varchar(128)
as
        -- test to ensure the argument is the name of a real table
        if @TableName not in (select distinct TABLE_NAME from INFORMATION_SCHEMA.COLUMNS)
        begin
                declare @ErrorMessage varchar(max)
                set @ErrorMessage = 'There is no table or view named ''' + @TableName + '''.'
                raiserror(@ErrorMessage, 16, 1)
        end
        else
        begin
                -- set up cursor
                declare #c cursor local for
                        select COLUMN_NAME + '=''' + COLUMN_NAME + ''',' ColumnAssignment
                        from INFORMATION_SCHEMA.COLUMNS
                        where TABLE_NAME = @TableName
                        order by ORDINAL_POSITION
                open #c

                -- construct an execution string
                declare @ExecString varchar(max)
                set @ExecString = 'select '
                declare @ColumnAssignment varchar(100)
                fetch next from #c into @ColumnAssignment

                while @@fetch_status = 0
                begin
                        set @ExecString = @ExecString + @ColumnAssignment
                        fetch next from #c into @ColumnAssignment
                end

                set @ExecString = left(@ExecString, len(@ExecString)-1)

                -- tear down cursor
                close #c
                deallocate #c

                -- execute execution string
                exec(@ExecString)
        end
go
We invoke this procedure by passing it the name of a table or view:
exec ColumnHeaders 'TBgeoSTATEPROVINCE' -- supply your own table name as an argument
The output looks like this:
It consists of a single row having the same column names as the columns in the specified table, with each column containing its own name. This row can be pasted into the first row of an Excel spreadsheet. Subsequently you can query contents of the table or view itself, producing rows having the same schema, and append that query's output to the column-header row in your Excel sheet.
For example it takes only a few seconds to copy and paste the outputs of these two statements:
-- supply your own table name as an argument
exec ColumnHeaders 'TBgeoSTATEPROVINCE'
-- query some subset of your own table or view
select * from TBgeoSTATEPROVINCE where StateProvinceName like 'A%'
to produce a spreadsheet that looks like this:
StateProvinceId StateProvinceName StateProvinceCode CountryId Notes CreatedById CreationDate AuditDate AuditUserId AuditStatus 1 Alabama AL 222 NULL 1 9/5/2008 13:50 9/5/08 13:50 1 I 2 Alaska AK 222 NULL 1 9/5/2008 13:50 9/5/08 13:50 1 I 3 Arizona AZ 222 NULL 1 9/5/2008 13:50 9/5/08 13:50 1 I 4 Arkansas AR 222 NULL 1 9/5/2008 13:50 9/5/08 13:50 1 I
Color alternate sets of rows in a spreadsheet
Once you've gotten your column headers and query output into an Excel sheet, the sheer amount of data is often mind-numbing. Your data will generally contain groups of rows having the same business key. I like to paint such sets of rows in alternating colors so that readers can easily group the related rows. Coloring groups of rows by hand can be very tedious and error-prone, so here is some code that does it automatically.
First we have a comment. I strongly recommend keeping this at the top of your copy of this code because it tells everyone exactly how to incorporate the code into an Excel workbook:
' Automatically color alternating sets of rows of the current sheet, based on the data in one of the columns.
' This macro automatically figures out how wide and tall your data is.
' Instructions:
'    1. Open your spreadsheet.
'    2. Open "Tools|Macros|Visual Basic Editor"
'    3. Right click on "This Workbook" and select "View Code", which should open a page on the right.
'    4. Copy the entire contents of this file into that page.
'    5. Close the "Visual Basic Editor" by killing the whole interface that came up when you did step 3.
'    6. The macro will now operate on any page of your workbook:
'     * copy your data into an empty sheet
'     * select "Tools|Macros"
'     * select "ColorAlternateDataRows" from the list
'     * enter the requested row and column numbers
'
Option Explicit
Next is a function that returns the numeric index of a column, given its alphabetic name. This allows us to convert a user-specified column name into an index, so that we can invoke Excel library functions that take column indices as arguments:
' Return the 1-based index of a column, given its name.
' We presume fewer than 2**31 - 1 columns.
Private Function ColumnIndex(ColumnName As String) As Integer
    Dim ReturnValue As Integer
    ReturnValue = 0
    Dim CharIndex As Integer
    CharIndex = 1
    Do While CharIndex <= Len(ColumnName)
        Dim ThisChar As String
        ThisChar = Mid(ColumnName, CharIndex, 1)
        If ThisChar >= "A" And ThisChar <= "Z" Then
            ReturnValue = ReturnValue * 26 + (Asc(ThisChar) - Asc("A") + 1)
        ElseIf ThisChar >= "a" And ThisChar <= "z" Then
            ReturnValue = ReturnValue * 26 + (Asc(ThisChar) - Asc("a") + 1)
        Else
            ReturnValue = -1
            GoTo Ret
        End If
        CharIndex = CharIndex + 1
    Loop
Ret:
    ColumnIndex = ReturnValue
End Function
The following function tries to collect a positive integer from the user, cycling until it gets one or until the user cancels. This is used to collect the starting row number for the coloring (the user may have header rows that should not be colored):
' Retrieve a positive (long) integer from the user.
Private Function GetPositiveInteger(Text As String, Optional AllowColumnNames As Boolean = False) As Long
    Dim Data As Long
    Data = -1
    Dim FirstIteration As Boolean
    FirstIteration = True

    Do While Data < 0
        Dim S As String
        If FirstIteration Then
            S = InputBox(Text)
        Else
            If AllowColumnNames Then
                S = InputBox(Text & " We need a positive integer.")
            Else
                S = InputBox(Text & " We need a column name or a positive integer.")
            End If
        End If
        If Trim(S) = "" Then
            GoTo Ret    ' cancel
        ElseIf IsNumeric(S) Then
            ' See if it's an integer directly.
            If CInt(S) > 0 Then
                Data = CInt(S)
            End If
        ElseIf AllowColumnNames Then
            ' See if it's a column name.
            Dim ColNdx As Integer
            ColNdx = ColumnIndex(S)
            If ColNdx > 0 Then
                Data = ColNdx
            End If
        End If
        FirstIteration = False
    Loop
Ret:
    GetPositiveInteger = Data
End Function
This function is the actual macro that the user invokes. It does the following:
- collects the desired starting row from the user
- collects the column name of the (single) column whose changing value will cause a change in row color
- computes the total "used range" (i.e. span of cells that are occupied) of the currently active workbook
- colors the rows in alternating colors
' Color alternate data rows based upon business-key information provided
' interactively by the user.
Sub ColorAlternateDataRows()

    Dim FirstDataRow As Long
    Dim TestDataInColumn As Integer


    Dim S As Worksheet
    Set S = ThisWorkbook.ActiveSheet

    If Not (S Is Nothing) Then

        FirstDataRow = GetPositiveInteger("Enter the NUMBER of the FIRST ROW containing data to be colored.")
        If FirstDataRow <= 0 Then Exit Sub
        TestDataInColumn = GetPositiveInteger("Enter the COLUMN NAME of the column containing the changing data.", True)
        If TestDataInColumn <= 0 Then Exit Sub

        Dim CurrentData As String
        CurrentData = ""

        Dim Width As Integer
        Width = S.UsedRange.Columns.Count

        Const ColorIndex1 As Integer = 36   ' light yellow
        Const ColorIndex2 As Integer = 34   ' light blue

        Dim ColorIndex As Integer
        ColorIndex = ColorIndex2

        Dim RowIndex As Long
        Dim LastRow As Long
        LastRow = S.UsedRange.Rows.Count
        For RowIndex = FirstDataRow To LastRow
            ' change the color if necessary
            If CurrentData <> CStr(S.Cells(RowIndex, TestDataInColumn)) Then
                If ColorIndex = ColorIndex1 Then
                    ColorIndex = ColorIndex2
                Else
                    ColorIndex = ColorIndex1
                End If
                CurrentData = CStr(S.Cells(RowIndex, TestDataInColumn))
            End If
            ' apply the color
            S.Range(S.Cells(RowIndex, 1), S.Cells(RowIndex, Width)).Select
            With Selection.Interior
                .ColorIndex = ColorIndex
                .Pattern = xlSolid
            End With
        Next

    End If

End Sub
You can copy and paste all the above code into a single file that can be incorporated into any desired Excel workbook.
Now let's see what this looks like when we run it. We'll start with a trivial Excel sheet containing some data that came from a SQL Server table or view (header row colored by hand):
Number Letter 1 A 2 A 3 B 4 B 5 C
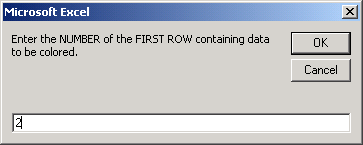
We execute the macro and it pops up this dialog. We've already colored the header row by hand, so to avoid having the macro re-color it we tell the macro to start coloring with row 2:

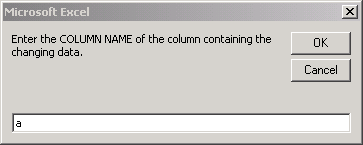
Up pops another dialog. Here we tell the macro that it should change row color every time the value in column A changes.

After hitting OK the macro produces this:
Number Letter 1 A 2 A 3 B 4 B 5 C
We can now rerun the macro, telling it to change colors on changes in column B instead, and we get this:
Number Letter 1 A 2 A 3 B 4 B 5 C
Note that the macro assumes only a single-column key, which I have found to be sufficient for the vast majority of my uses. The macro can of course be modified to accept a range of columns instead of just one. I leave this as an exercise for the reader.
Summary
Using these two macros I have quickly become the favored documenting person of almost every team in which I've worked. In a matter of seconds I can generate a well-colored Excel table that has column headers. It may seem like a small thing, but for me it's had a huge effect.
System Requirements
The stored procedure requires that you be running SQL Server 2005 or higher. The Excel macro was implemented using Excel 2003; it has not been tested in other Excel versions.
Author
You can contact me (Dave Ziffer) via the "Contact" link on my company's web site at www.ProjectPro.com. I'm also on LinkedIn. To keep abreast of my upcoming articles and projects, join the LinkedIn "Rapid Application Prototype" group.


