Introduction
In a previous article, we talked about Azure Machine Learning (ML). This time we will create our first ML model from 0 to predict data. The predictions will be obtained from the data stored in an Azure SQL Warehouse. If it is your first time with Azure, Machine Learning and Azure SQL Warehouse, this article is for you. We will start from 0.
In Bolivia, my country, the Yatiri is a wise indian who is consulted to predict the future and make decisions. People provide him some information about our problem and the Yatiri predicts the future using coca leaves.

The ML is basically the same than the Yatiri (these Yatiris are very accurate in the predictions). We provide a data source with information and with advanced algorithms, the ML predicts the future.
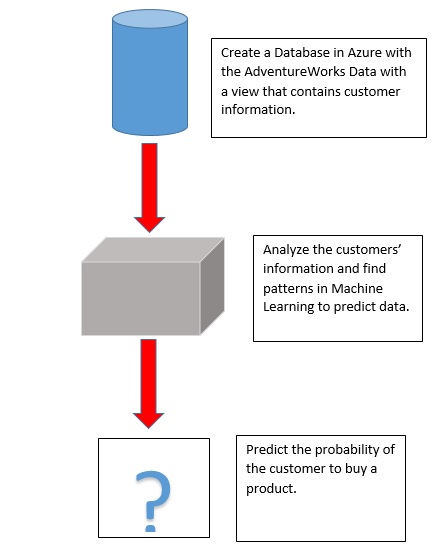
In this example, we will first create a Database in Azure with the AdventureworksDW Database. This database contains a view that we used in our Data Mining Series. After creating the database, we will create the ML model to predict the future. The following diagram resumes what we will do:
Requirements
1. Just an Azure Account.
Getting Started
We will first create a database in Azure with the adventureworksDW database. In the second part, we will analyze the information with ML.
Creating an Azure SQL Data Warehouse
Basically, in Azure the Databases have the following components:
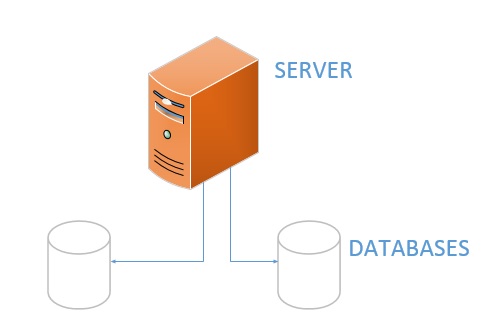
When we create a Database we need to specify a Server. If it does not exist, we need to create a Server with an Administrator name and a password.
The database in Azure requires the performance option, which is related to the price.
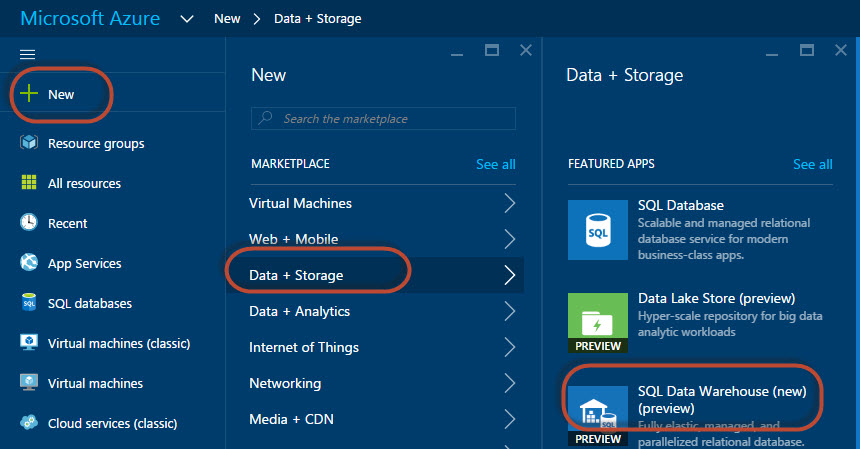
1. To create the database, in the Azure Portal, go to New>Data+Storage>SQL Data Warehouse.
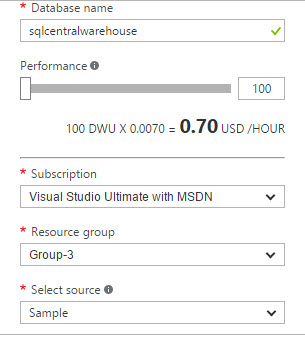
2. Select a performance option (100 is the cheapest), a subscription and a Resource Group (create a new one). In Select source, select the Sample AdventureWorks DW. The performance provides the information in DWU which are units to measure the performance of the Data Warehouses in Azure. The resource groups are just containers to manage the resources. The subscription is the way you subscribed to the Azure portal.
3. Create a new server and add a login and a password.
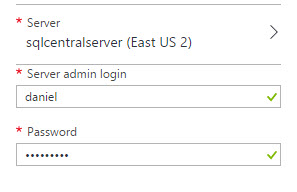
4. We created a SQL Database with the Adventureworks database. Inside the database, we have the vTargetMail view.
Machine Learning
In the Adventureworks database, we have the vTargetMail view. This table contains the information about the customers. With this information, the ML can learn and find patterns to guess the behavior of new customers. We will do the following in ML:
- Create a Workspace (a space to store the experiments)
- Open the ML Studio (the experiments are created in ML)
- Create a experiment (like a project).
- Import the data from the view.
- Select Columns in dataset (filter the columns to use only the required ones)
- Split data (part of the data will be tested and part will be analyzed by the algorithm)
- Score Model (this module will detect the probability of the customers to buy a product.
- The Evaluate Module (this module evaluates the accuracy of the model and detects if the model is valid by testing a sample of data)
- Train Model (this section will analyze the information and will get the results from the decision tree.
- Multiclass Decision Forest (this is a decision tree algorithm that will be used to analyze the information)
1. We have a Database with a View to analyze in Machine Learning (ML).
2. To start ML, press the + icon and go to Intelligence>Machine Learning:
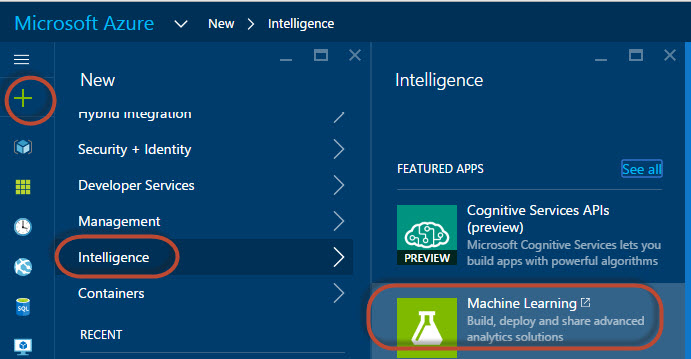
3. You will need to create a Workspace. The workspace is the space to store the ML experiments. Add a workspace name:
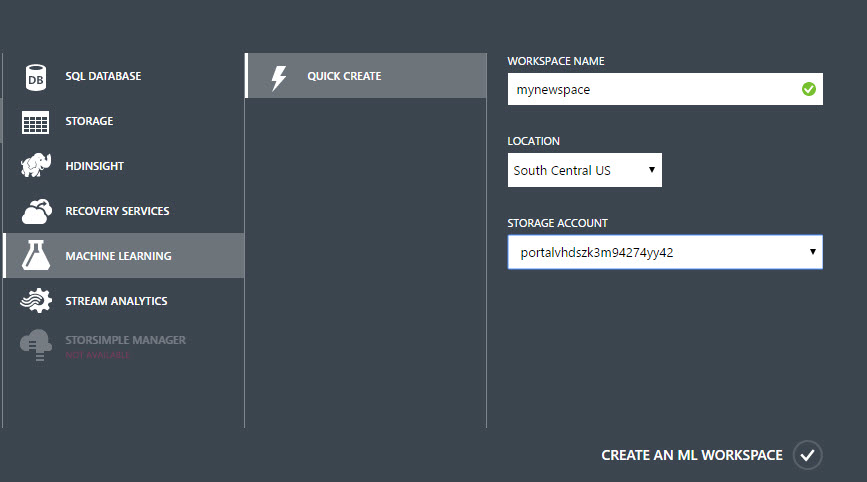
4. Click the Workspace created:

5. Sign in to ML Studio. The ML Studio is the tool used to create the ML experiments:
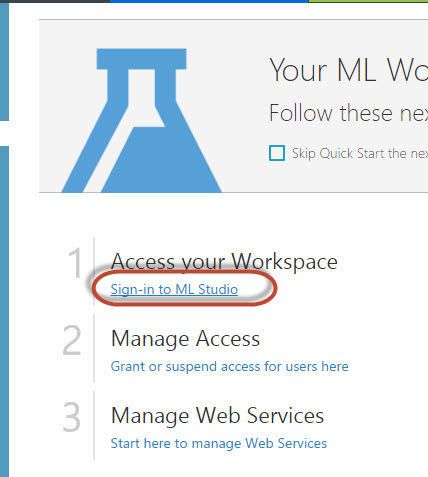
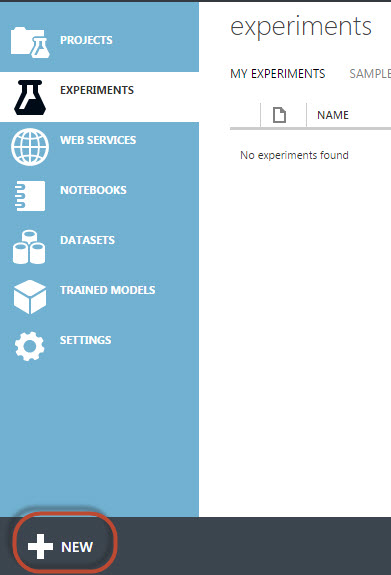
6. Click experiments and click the new icon to create a new Experiment. The experiment is like a ML project used to find patterns and analyze the data:
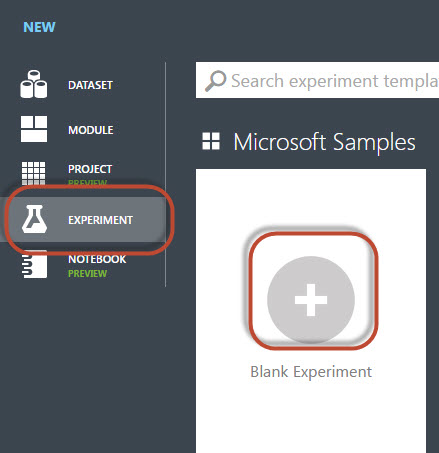
7. There are several ML examples available that you can use to learn ML. In this article, we will create a new one from 0:
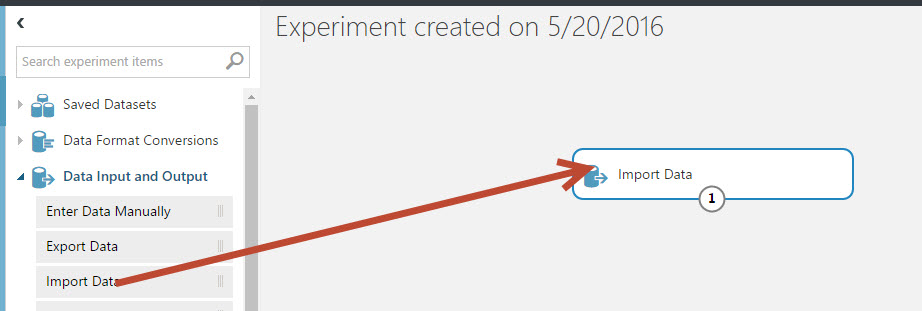
8. In the Experiment, drag and drop the Import Data module. With this module, we will import the View from the SQL Database:
9. In the Azure Portal go to databases and click on the SQL Data Warehouse created. Check the server name and the database name and return to the ML experiment:
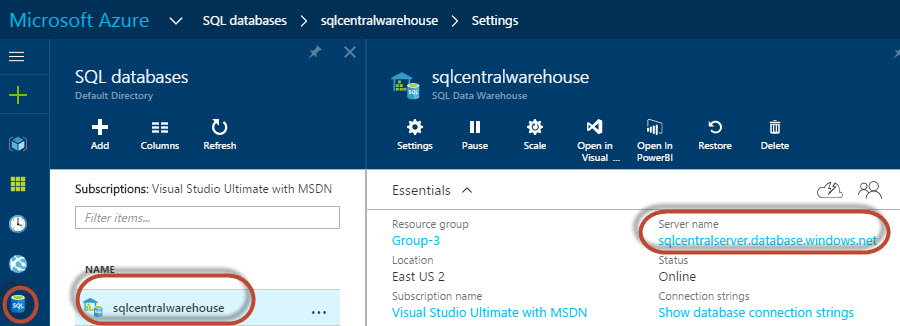
10. In the Properties of the Import Data module, select Azure SQL Database as the Data source. In the Database server name, copy the name of the step 9 and in the Database name, copy the name of the database name created for the Data Warehouse created at the beginning. You will also need the User name and password of the User created for the SQL Data Warehouse database.
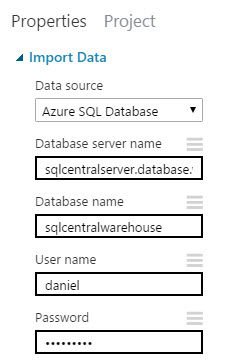
11. In the database query, run the following query:
SELECT [CustomerKey]
      ,[GeographyKey]
      ,[CustomerAlternateKey]
      ,[Title]
      ,[FirstName]
      ,[MiddleName]
      ,[LastName]
      ,[NameStyle]
      ,[BirthDate]
      ,[MaritalStatus]
      ,[Suffix]
      ,[Gender]
      ,[EmailAddress]
      ,[YearlyIncome]
      ,[TotalChildren]
      ,[NumberChildrenAtHome]
      ,[EnglishEducation]
      ,[SpanishEducation]
      ,[FrenchEducation]
      ,[EnglishOccupation]
      ,[SpanishOccupation]
      ,[FrenchOccupation]
      ,[HouseOwnerFlag]
      ,[NumberCarsOwned]
      ,[AddressLine1]
      ,[AddressLine2]
      ,[Phone]
      ,[DateFirstPurchase]
      ,[CommuteDistance]
      ,[Region]
      ,[Age]
      ,[BikeBuyer]
  FROM [dbo].[vTargetMail];
12. This query will retrieve the vTargetMail rows. Run the experiment. Note that a ; is used at the end of the sentences instead of the GO.

13. The Import Data will fail.

14. If you check the properties, you will see the error message. Press the view Error Log:
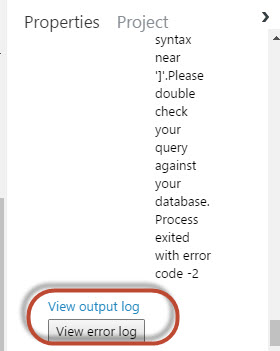
15. The error is that the Decimal Data Type is not supported:

16. We will convert the YearIncome column to Integer in the query with the cast function:
--REPLACE THIS:
,[YearlyIncome]
--WITH THIS:
,cast([YearlyIncome] as int) as YearlyIncome
17. We converted the decimal value to integer. If we run the module again, we can now visualize the data:
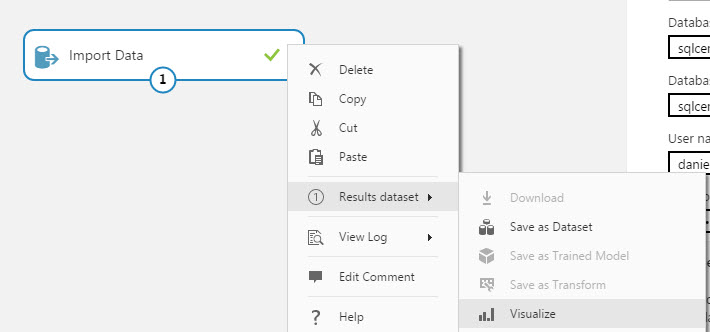
18. You can now visualize the view information imported to ML:
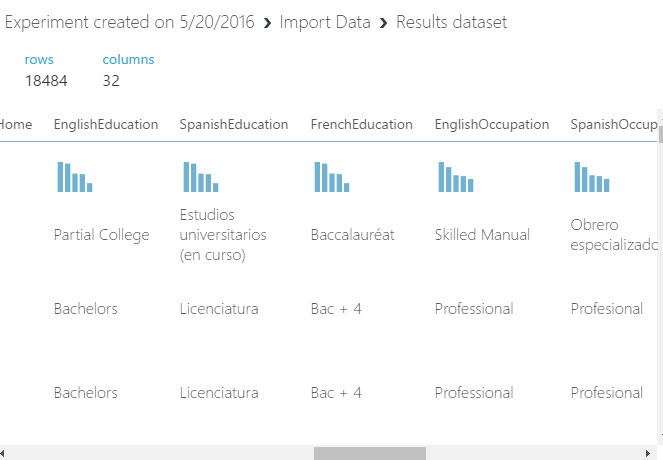
19. We just imported the data to our ML experiment. However, we do not need all the columns from the view. In order to select only the required columns, we will filter the required columns using the select columns in Dataset:
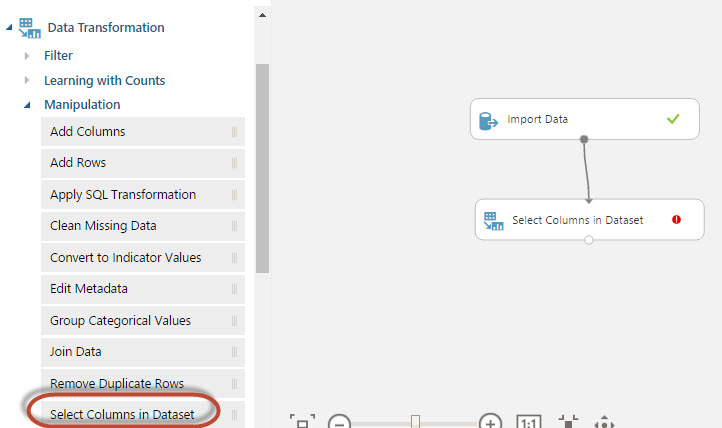
20. In the right pane, click Launch column selector:

21. Select the following columns and then join the modules:
- Marital Status.
- Gender.
- YearIncome.
- TotalChildren.
- NumberChildrenAtHome.
- EnglishEducation.
- EnglishOcupation.
- HouseOwnerFlag.
- NumberCarsOwned.
- CommuteDistance.
- Age.
- BikeBuyer.
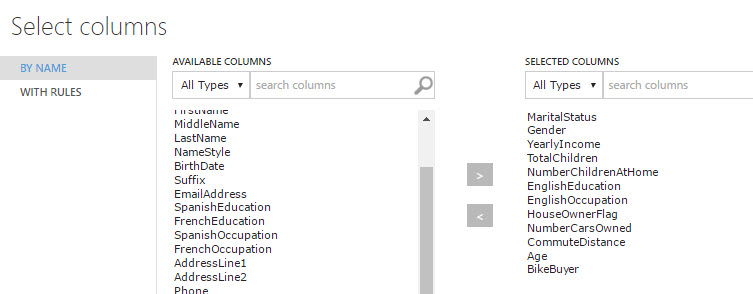
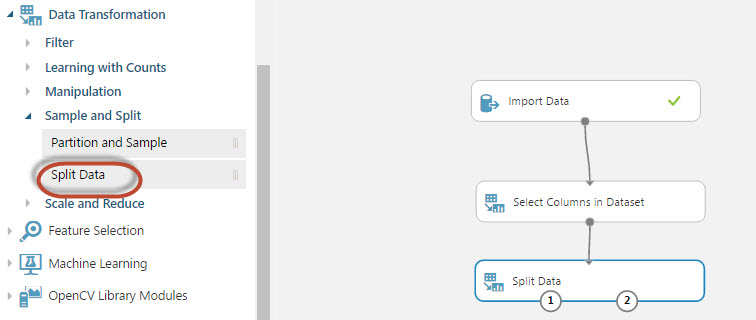
22. We selected the columns that can be useful to predict the customer behavior. The next step is to drag and drop the Split Data task. We will split the data so that part is used to train the model and the other to score the model. The Train model will be used to predict possible models and the Score will be used to measure the accuracy of the model:
23. Drag and drop the Train model and the score model nodes and Join the nodes as shown in the picture:
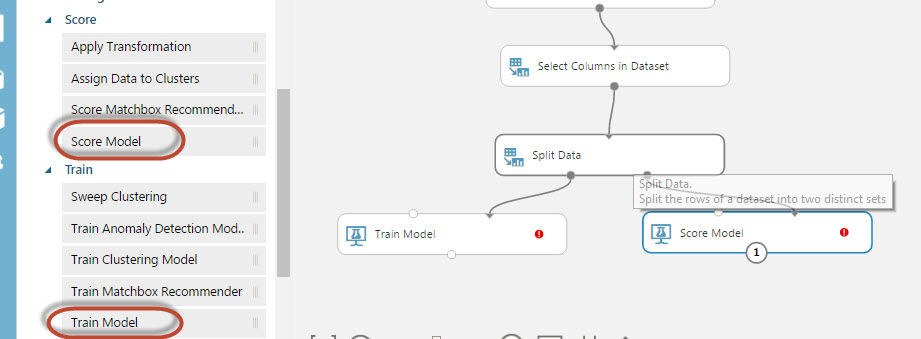
24. Drag and drop the multiclass Decision Forest node and join the module to the train model. The multiclass decision forest module is the algorithm used to analyze the data. There are several algorithms, but this one is the easiest for newbies.
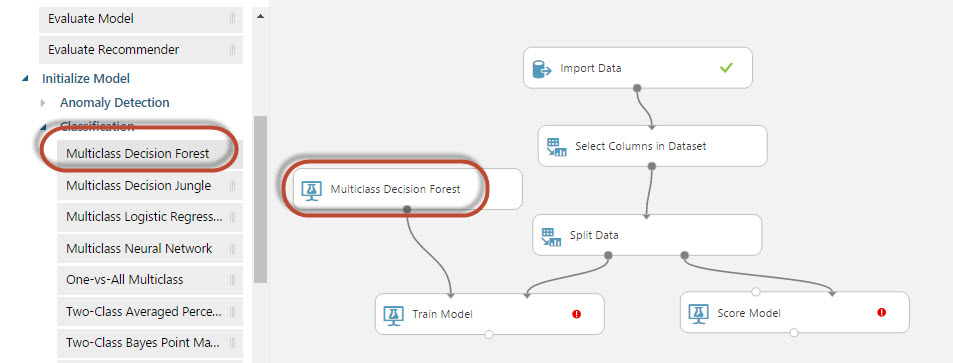
25. Click the train model and click the launch column selector:
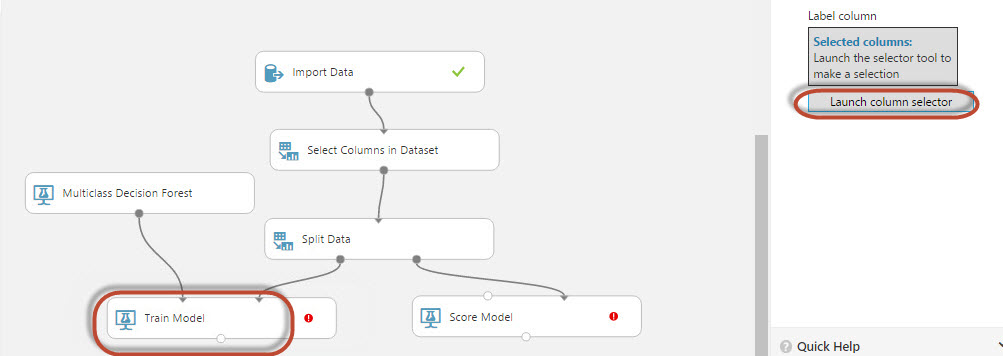
26. Select the bike buyer column. The train model will analyze the bike buyer column. This column contains two values. 0 and 1. 0 means that the customer will not buy the product (based on the customer information) and 1 means that he will buy the product. Our model will predict if the customer will buy the product or not.

27. Drag and drop the score model:
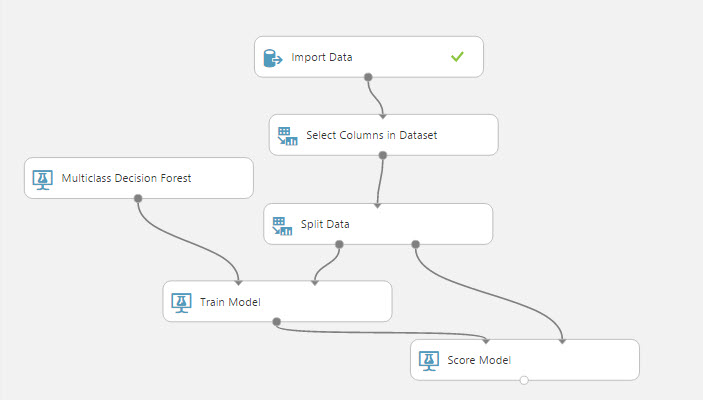
28. Drag and drop the Evaluate Model:

29. Save and run the experiment and run it:
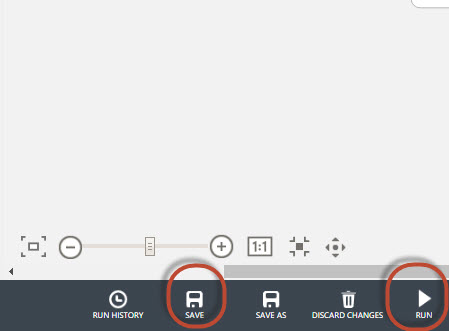
30. Right click the Evaluate Model module and select the Evaluation results>Visualize option:

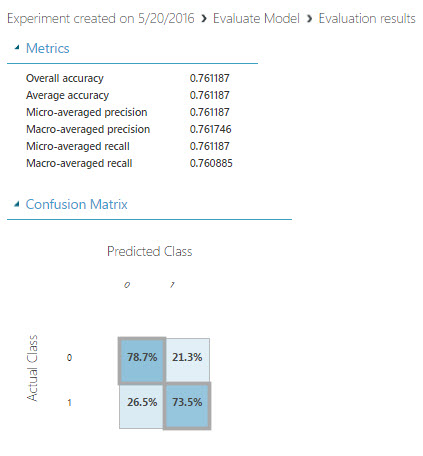
31. The Evaluate module allows seeing if the Data Mining model is accurate. It compares the real results with a sample of data. If the sample data matches the real values, the model is accurate. In this case, the accuracy of the model is 76% (0.76). This value is acceptable:
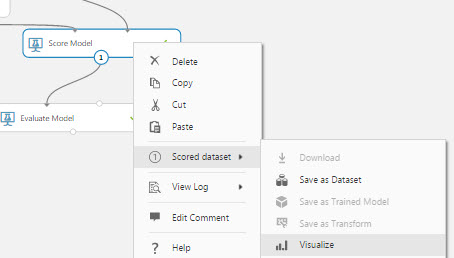
32. Right click the Score Model module and select the Scored dataset>Visualize option:
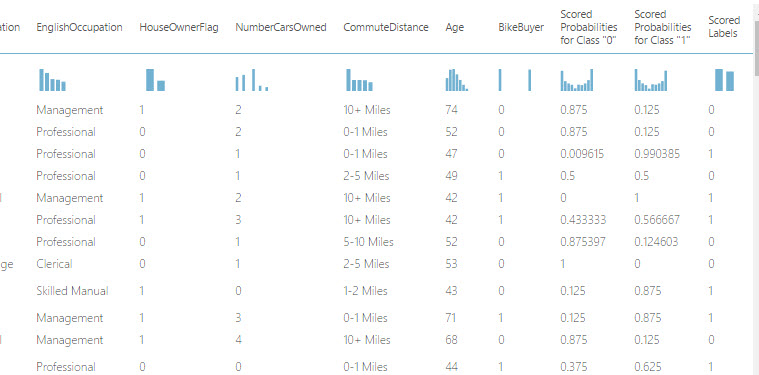
33. The scored probabilities show the customers' probabilities to buy products. For example, in the first row, a professional in Management with 2 cars owned and a commute distance of 10+ miles and 74 year old has a probability of 12.5% (0.125) to buy a car:
Conclusion
We created a ML experiment ready to predict the future. In the next chapter we will show how to predict data with this model. We had to create an Azure SQL Data Warehouse with the AdventureworksDW database because this database contains an example for data mining. We used the vTargetMail view of the AdventureworksDW database to create an experiment in ML.
In Machine learning, we need to train the data with the algorithm and evaluate the algorithm. In this example, the accuracy of the algorithm was 76%. In the score module, we could find the probabilities of the customers to buy a product. As you can see, ML is similar to Microsoft SQL Data Mining, but in ML, you cannot visualize the trees. We will learn a little bit more about ML in future chapters.


