The first time I touched SQL Profiler was to find out what long running
queries were hammering a particular database. That was the moment I fell in love
with this tool. I've used it to find stored procedure recompiles, infinite
program loops on the client-side, and other performance no-nos in my career as a
DBA. However, I've also used SQL Profiler heavily as an audit tool, especially
if I want to watch traffic on my SQL Server in real time. If I want to collect
events for later analysis I'll tend to use the trace stored procedures but they
can't stand up to the flickering of events on my console when I'm trying to
troubleshoot a security issue. SQL Profiler is ideal for this task.
Building a Trace Template
When working with SQL Profiler, I tend to build my own trace templates. If I
know I'll be using the same settings more than once, I build a trace template
which I can re-use as much as I need to. The first step to building a
trace template is to start a new one by File | New | Trace
Template. The General tab gives us the option to "Save As"
which is useful if we're copying a template to modify. However, in this example
we're starting a new one so we can ignore this tab and go on to the Events
tab. For the sample template I'm building, I'll expand the Security Audit
group and select the following event classes: Audit Login, Audit Login
Failed, and Audit Logout (Figure 1). At first glance this doesn't
seem to do anything more for us than setting the Audit Level through Enterprise
Manager. When we get to Data Columns, I'll show that it does.

Figure 1: Events to Audit
Now that we have our Events set, we'll proceed to the Data Columns
tab. There are several data columns we'll want to keep track of. By default
EventClass and SPID are selected already. Add to that HostName,
LoginName, and ApplicationName (Figure 2). Already you can see we're
adding two pieces of information we don't get by changing the audit policy: the
name of the computer connecting and the application being used to do so. I did
not choose NTDomainName and NTUserName for a reason. When we're
dealing with a Windows login, LoginName will show it in the form of <Domain
Name>\<User Name> and while it is possible to create a SQL Server
login matching that pattern, it's not a good idea to do so and most of us
wouldn't anyway. Therefore, if you can handle MyDomain\MyUser in LoginName
there is no reason to add the two NT data columns.

Figure 2: Data Columns
The last thing to do is set some filters. We don't want all activity to be
seen in our Profiler traces, only activity relevant to users actually connecting
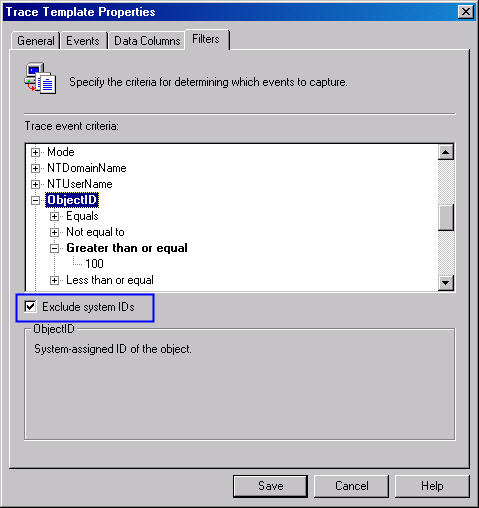
to the SQL Server. The first thing to do is check Exclude system IDs as
I've highlighted in Figure 3. This will prevent any processes SQL Server itself
runs from showing up in our Profiler trace.

Figure 3: Excluding system processes
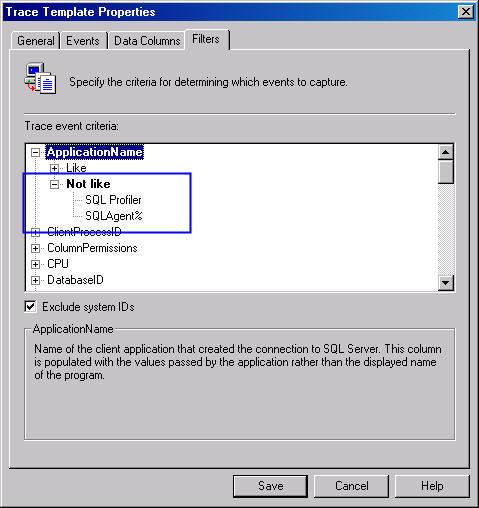
We also want to make sure SQL Profiler doesn't show up, either. By setting
the ApplicationName not like SQL Profiler, we filter out any
events caused by our own trace (as well as a trace someone else might be
running). If you have SQL Server Agent running, you'll most likely want to
filter that out as well. You can do so by setting an additional Not like filter
to SQLAgent%. I've done both in Figure 4 (highlighted in blue).

Figure 4: Excluding SQL Profiler and SQL Server Agent
The settings for the trace template are done and the only thing left to do is
click the Save button. Name the trace template anything you want. I chose
SQLProfiler_Login_Logout as we'll see in the next section.
Tracing with a Template
With the template complete, the next step is to begin our auditing using SQL
Profiler. You can start a new trace by selecting File | New | Trace.
The icon that looks like the SQL Profiler icon will also start a new trace as
will the shortcut CTRL+N. Once you do any of these, you'll receive the
standard SQL Server connection dialog window. Select the SQL Server you wish to
connect to and how you wish to authenticate. In SQL Server 2000 you'll need to
use a login which is a member of the sysadmin fixed server role. Profiler goes
and makes the connection for us and then presents us with a new dialog window
for us to choose our options when tracing.
There are a lot of trace properties we can set, but for now I'm only
interested in one: Template name. Set the template name to the trace
template you saved. In Figure 5 I've selected SQLProfiler_Login_Logout.
Once that is done, click Run to begin tracing.

Figure 5: Choosing the Template
You should see any new login attempts as well as any logouts with the
settings chosen. Everything else is filtered out. I do need to point out that
even if the audit policy is not set to record the events we've marked in our
template, SQL Profiler will still see them. If we don't have auditing turned on
but we have an immediate to watch logins and logouts, we don't have to change
the setting and restart SQL Server. Rather, using SQL Profiler or the proper set
of trace stored procedures and we're all set. We can see Windows and SQL Server
logins in real time on a console rather than checking a log file.
Windows Logins
Let's start with Windows logins. As I said earlier, Windows logins will
appear in Profiler as <Domain Name>\<User Name> for the
LoginName. The EventClass will be very obvious as is the case with Audit
Login Failed in red (Figure 6). On a failed login the Application Name is
returned, but not the HostName. This is one drawback of the auditing
capabilities of SQL Server. I see questions about how to get the IP address for
a given SPID, but unfortunately SQL Server does not record that information in a
table or mechanism we can use. In the case of Profiler, HostName is also
missing. However, we do at least have the LoginName and the ApplicationName as
in figure 6.

Figure 6: Audit Failure
In figure 7, successful logins and logouts appear in green, signifying things
are okay. Notice that on some of the login/logout events the HostName is not
captured. Whenever Query Analyzer first connects, it doesn't send the host name
for whatever reason. What's that you say? The application sends the host name?
Indeed it does. And that explains why on a failed login attempt we don't have
anything in that column. If you're a paranoid sort, you're probably thinking
this can be abused. You'd be right but we'll save that for a bit later.

Figure 7: Audit Success
SQL Logins
Auditing SQL Server-based logins is no different. We still get the EventClass
in red and the blank HostName in the case of a failure. The LoginName appears in
the format we'd expect, as it does in figure 8.

Figure 8: Audit Failure
Successful logins are much the same as well (Figure 9). Notice again the
HostName is missing when Query Analyzer first logs in and then logs out.

Figure 9: Audit Success
With the trace template we've created, auditing logins and logouts visually
is easy. The nice thing about having Profiler up is you can watch activity in
real time. This is key when you're troubleshooting a particular application to
see if it's making a connection to SQL Server. Here's an example: I was helping
determine what was wrong with a particular application because it couldn't make
a proper connection to the SQL Server. The developers claimed they have the
connection string correct and they were right. The application made a connection
using Windows authentication but Profiler showed the login was incorrect. The
LoginName I saw come across the screen didn't match the service account we were
expecting. After a bit of looking, they realized the identity of the COM+
component had been set wrong. A quick change and the application was up and
running. These are the types of problems you can solve with Profiler.
A Major Proviso
But when it comes to auditing, Profiler does have a significant limitation,
though this is not Profiler's fault. The problem pervades anywhere in SQL Server
where tracing is used. As I stated above, the application sets the HostName. In
the initial connections of Query Analyzer, it wasn't setting the HostName. But
what about other apps? Figure 10 shows a standard Microsoft Access connection.
Based on the LoginName I'm obviously dealing with a Windows account. I have what
appears to be a valid HostName as well as a valid ApplicationName. If I didn't
know any better, I'd think this was always the case.

Figure 10: What We Expect
But it's not. Not only can the HostName be set by the application, so too can
the ApplicationName. Figure 11 demonstrates this with Spoofed! where we'd
expect valid entries.

Figure 11: Faked Information
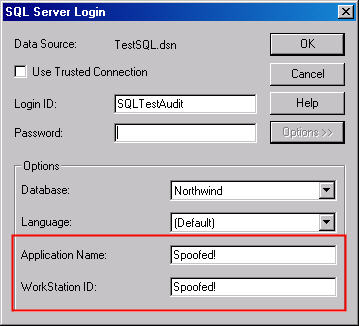
How easy is this to do? It's trivial. Figure 12 is a snapshot of the SQL
Server Login connection properties for a linked table in Microsoft Access. If I
click on the Options >> button I can set the database and the
language. That's reasonable. But I can also set the Application Name and the
Workstation ID! And that's all there is to it.

Figure 12: Setting the Information in MS Access
Is there anything we can do about this? Unfortunately, no. But then again, in
the majority of cases it isn't an issue. The HostName and ApplicationName will
appear correctly and our auditing will be just fine. If we do see cases like
this, it's time to break out some additional tools such as a network sniffer or
the like. Our options don't stop with SQL Server's set of tools. Therefore,
while the HostName and the ApplicationName can be set, for the most part the
information we get back in SQL Profiler will be accurate. In every case the
LoginName as well as the proper EventClass will be recorded. So it's not time to
throw the baby out with the bath water, as the saying goes. As a DBA we just
have to be cognizant that these two data columns can be forged.
Conclusion
While SQL Profiler is often cited as a tool for performance tuning, it can
also help us in the security realm. Using the simple example of auditing logins,
we can demonstrate the usefulness of running a trace and seeing what users are
logging in, from what systems, and with what applications. While there is the
ability to alter the workstation and application names, this doesn't occur in
most cases. Therefore, Profiler is often all we need.
This has been a rather limited example of what SQL Profiler can do for us on
the audit front, but hopefully if you've not this tool in that capacity it gives
you some ideas for the future. I know when I'm done things in real time,
Profiler is the first tool I stand up.
Additional Resources
- Profiler - Logging Results to a Table by Andy Warren - http://www.sqlservercentral.com/columnists/awarren/profilerloggingresultstoatable.asp
- Support Webcast: SQL Server 2000 Profiler: What's New and How to
Effectively Use It - http://support.microsoft.com/default.aspx?kbid=325263
© 2004 by K. Brian Kelley. http://www.truthsolutions.com/ Author of Start to Finish Guide to SQL Server Performance Monitoring (http://www.netimpress.com). |

