The Management Data Warehouse (MDW) was introduced as a new feature in SQL Server 2008. This feature provides a centralized, integrated system that can be used to collect and store data about a variety of interesting database server metrics. The MDW accomplishes this via the use of targets and collection sets. Targets consist of the database servers you are interested in collecting data on, while collection sets define the parameters of the data to be collected.
The MDW comes pre-loaded with three system collection sets right off the bat: Disk Usage, Query Statistics, and Server Activity. In this article I will present a case study of using the MDW along with the built-in Disk Usage collection set to serve a request presented to me by upper management. I hope to demonstrate how the MDW can provide a robust, flexible architecture for storing and reporting on system metrics across multiple database servers.
Setting up the problem
My company aggregates and stores loan-level data in the form of various different products related to the mortgage servicing industry. This data is processed and maintained on multiple internal production database servers. While we performed an initial "siloing" of data onto different servers based on product/function during a recent datacenter migration, the OLAP-oriented nature of our data environment combined with cross-pollination between products makes it impractical to segregate data solely based on product.
As such I was given the task of creating a system that can be used to map existing and new databases to a product based on name (which is governed by internal naming policies). This system should have the ability to display growth trends by product (as both an absolute and relative to other products) over a variety of different reporting periods, with weekly being the most granular. The consumable product should be a report in SQL Server Reporting Services (SSRS) that the user can filter by product, class of data (i.e. data, index, or log) and baseline reporting period. There should also be an automated delivery mechanism to relevant management personnel showing the data growth trends for all products.
This immediately brought to mind the MDW feature that I had configured some time ago but rarely used for much other than ad-hoc investigations into historical server performance.
Considerations for the MDW
Let me begin by saying that this article is not meant as a guide for the initial installation and configuration of the MDW. Kalen Delaney has an excellent community article on MSDN (http://msdn.microsoft.com/en-us/library/dd939169%28SQL.100%29.aspx) that describes the basic architecture, installation, and use of this feature. I'm more interested in providing a practical use case for the MDW after it has been configured and active in your environment for some period of time.
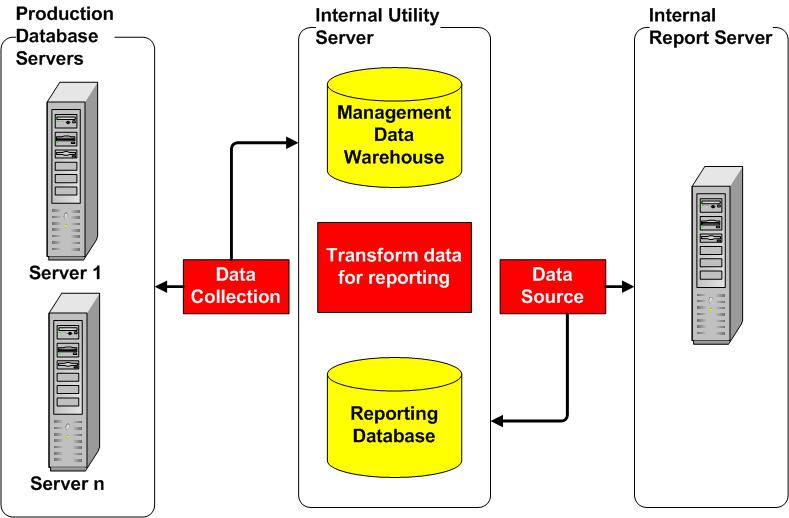
That being said it is important to understand the architecture used in the presented solution, shown below in Figure 1:

Figure 1: MDW collection and reporting architecture
As you can see, the MDW has been configured on a separate internal "utility" server that is used for a variety of different monitoring and administrative tasks. This is a fairly standard scenario, as we typically don't want the MDW to be on a monitored server due to performance/manageability reasons.
In this architecture the basic flow of events is as follows:
- Configured data collection sets operate against the defined targets, in this case the production database servers
- Data is collected and stored in the MDW based on the schedules defined for the relevant collection sets (discussed further below)
- Data is left "as is" in the MDW and transformed/loaded into a separate reporting database. This database is used as the data source for an internal SSRS instance
Configuring the data collection set
At this point it is important to validate the collection set properties for your data collectors based on a) how frequently you would like to collect and upload data and b) how long you would like to retain data. You can view these properties by expanding Management > Data Collection > System Data Collection Sets under Object Explorer in the SSMS GUI on the instance where you have configured the MDW.
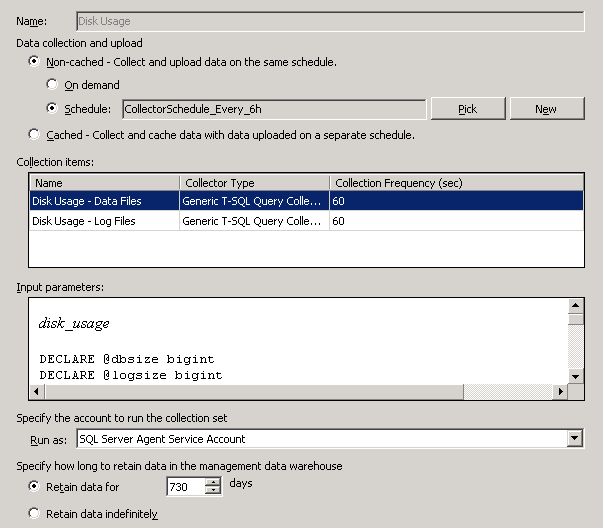
Figure 2 shows the properties that I have defined for the built-in Disk Usage collection set that we will be working with:

Figure 2: Properties for the Disk Usage data collection set
As you can see, I have configured the Disk Usage data collection set to a) collect and upload data every 6 hours and b) retain data for 730 days. This highlights one of the great strengths of the MDW in my opinion, that being flexibility. If you require detail at a more (or less) granular level it is simply a matter of changing the schedule that the data collector operates on.
For example, if you work in an OLTP environment you may want to see trending at a finer level of detail without negatively affecting performance on your production servers. In this scenario you may choose the cached option, allowing you to collect data at more frequent intervals and upload them in bulk on a less frequent schedule. It is simply a matter of understanding your environment as well as the tradeoff between granularity and size/performance of the MDW.
Using the MDW data for reporting
Now that I've briefly discussed initial configuration I'll move ahead to the point where the MDW has been configured and running for a while and you have disk usage data available to work with. Given the stated problem definition the next steps are to:
- Map databases to their relevant products
- Transform the data in order to classify it by data/index/log within the relevant products
- Combine product mapping logic with the transformed disk usage data to form the basis for the report
You can use the attached scripts to create the relevant objects in your MDW and server reporting databases, briefly described below (be sure to modify as necessary for your environment).
ServerReporting.sql
- ServerList - contains a list of the targets you have configured for the MDW (update the logic that loads this table if necessary)
- DatabaseProduct - used to store the database product mappings
- DatabaseProductShared - contains a list of databases that you have defined as shared resources (you should modify the logic that initially populates this table as needed)
- DiskUsageMart - used to store transformed disk usage data from the MDW
- vw_DiskUsageDetails - creates the view that ties disk usage data to database product mapping
- Pct - function that returns a percent for an input value as a function of the input base
- pr_GetProductSpaceTrendingInfo - stored procedure used to find space trending info over multiple reporting periods for the input product(s), data class(es), and baseline reporting period
MDW.sql
- Parameter - contains the name of your reporting database (change if necessary)
- SParam - returns a value from the Parameter table based on input Name
- pr_CreateSynonym - creates a synonym for the input object
- pr_LoadDiskUsageData - creates new database product mappings and transforms/loads data from the MDW into the reporting database (adapt the mapping logic to your environment)
Mapping databases to products and transforming the data
This step is accomplished by running the pr_LoadDiskUsageData stored procedure inside of your MDW database. It is important to note that I have defined this procedure to only load the reporting database once weekly on Sunday (controlled via a SQL Agent job scheduled to run sometime on Sunday morning after the Disk Usage collection set has run). This provides additional flexibility to abstract and transform data from the MDW on a more or less granular level based on requirements (i.e. while I collect data every 6 hours, I currently only want to report on weekly changes, although I have the flexibility to alter that logic if necessary down the road).
The first piece of work done by this procedure is the mapping of databases to products. This is done via the logic shown below (pared down from my actual production process), which you should alter based on internal products and database naming conventions:
MERGE dbo.syn_DatabaseProduct t
USING Stage s
ON t.ServerID = s.ServerID
AND t.DatabaseName = s.DatabaseName
WHEN MATCHED THEN
 UPDATE SET ProductType =
 CASE
 WHEN s.DatabaseName LIKE '%AwesomeProduct%' THEN 'AwesomeProduct'
 WHEN s.DatabaseName IN
 (
 SELECT DatabaseName
 FROM dbo.syn_DatabaseProductShared
 ) THEN 'Shared'
 ELSE 'RAndD'
 END
WHEN NOT MATCHED BY TARGET THEN
 INSERT (ServerID, DatabaseName, ProductType)
 VALUES (ServerID, DatabaseName,
 CASE
 WHEN s.DatabaseName LIKE '%AwesomeProduct%' THEN 'AwesomeProduct'
 WHEN s.DatabaseName IN
 (
 SELECT DatabaseName
 FROM dbo.syn_DatabaseProductShared
 ) THEN 'Shared'
 ELSE 'RAndD'
 END);
The mapping is done via a simple CASE statement that does the following:
- Maps databases that match the pattern 'AwesomeProduct' to the AwesomeProduct product
- Maps databases that we defined as shared resources (i.e. system databases, utility databases) to the Shared product
- Maps everything else to the RAndD product
New mappings are added to the DatabaseProduct table if the server/database mapping does not already exist. If the mapping does exist then the product is updated according to the CASE statement, making it easy to propagate logic changes to your reporting database. This is likely where you'll have to put the most work into adapting the process to work with your system (note that Stage is a CTE, the definition of which you can find in the attached creation script for pr_LoadDiskUsageData).
The next step is to transform and load the most recent collection of disk usage data into the reporting database. For every scheduled execution of the collection set a new snapshot is created for each target that the data collector operates against. Snapshots for the Disk Usage collection set are stored in the disk_usage table within the snapshots schema of the MDW.
If you examine the definition of this table you will notice that disk usage data is measured in pages. Given this the necessary steps include:
- Finding the most recent snapshot by target
- Transforming the snapshot data into a form that is usable for reporting (in this case I use megabytes)
- Loading the transformed data into the DiskUsageMart table inside of the reporting database
This is accomplished via the following code:
 ;WITH MostRecentSnapshot
 AS
 (
 SELECT instance_name [ServerName], MAX(sn.snapshot_id) [SnapshotID]
 FROM [snapshots].[disk_usage] d
 INNER JOIN [core].snapshots_internal sn
 ON sn.snapshot_id = d.snapshot_id
 INNER JOIN [core].source_info_internal si
 ON si.source_id = sn.source_id
 GROUP BY instance_name
 )
INSERT INTO dbo.syn_DiskUsageMart
 SELECT
 s.ServerID AS [ServerID]
 ,[database_name] AS [DatabaseName]
 ,DataSize = pages / 128
 ,IndexSize = (usedpages - pages) / 128
 ,LogSize = logsize / 128
 ,CAST([collection_time] AS smalldatetime) [CaptureDtTm]
 FROM [snapshots].[disk_usage] d
 INNER JOIN [core].snapshots_internal sn
 ON sn.snapshot_id = d.snapshot_id
 INNER JOIN [core].source_info_internal si
 ON si.source_id = sn.source_id
 INNER JOIN MostRecentSnapshot mr
 ON mr.ServerName = si.instance_name
 AND mr.SnapshotID = d.snapshot_id
 INNER JOIN dbo.syn_ServerList s
 ON s.ServerName = si.instance_name COLLATE SQL_Latin1_General_CP1_CI_AS
 WHERE s.IsActive = 1;
Note that the most recent snapshot is being loaded for all servers marked as active in the ServerList table. This allows us to retain data for deprecated instances inside of the MDW in case it is needed for future analysis.
You should be able to validate this logic by investigating the definition of the Disk Usage data collection set and researching the definition of the relevant system tables (sys.partitions, sys.allocation_units, and sys.internal_tables) on MSDN (note that you can also extrapolate free space by using the reservedpages column in snapshots.disk_usage; this is not something I was interested in tracking for this project).
Creating the disk usage view
Now that transformed disk usage data available inside of the reporting database the next step is to combine it with the DatabaseProduct table to aggregate data according to product and data class (data, index, and log in this scenario). You can do this by creating the vw_DiskUsageDetails view inside of your reporting database. This view simply combines each transformed snapshot with the previously defined database product mapping, and is used as the data source for the final deliverable to this solution, namely the SSRS report.
Creating the deliverable
The initial problem definition stated the need to find product growth over a variety of reporting periods, with weekly being the most granular. This is accomplished via the pr_GetProductSpaceTrendingInfo stored procedure, which is called to create the main dataset for the SSRS report.
This procedure first establishes a baseline reporting period and then creates cutoff dates for the additionally defined reporting periods (in my case I defined these as last week, last month, six months ago, and last year). It then gathers data for all reporting periods using the input product(s) and data class(es), and returns product growth rates by comparing the baseline reporting period to the other periods.
A few things you should notice about this procedure include:
- I'm taking advantage of the fact that the DiskUsageMart table is only loaded once weekly on Sundays. This allows me to easily define reporting periods and also offers the flexibility to add and modify reporting periods based on changing requirements. This is what we gain by defining granularity within the MDW and abstracting the reporting outside of the MDW.
- I'm creating a "pseudo" product called "All Products" (as well as a pseudo data class called "Z") that allows me to compare a specific product to all other products (in addition to comparing all products at once). This addresses the stated requirement of comparing products at both relative and absolute levels.
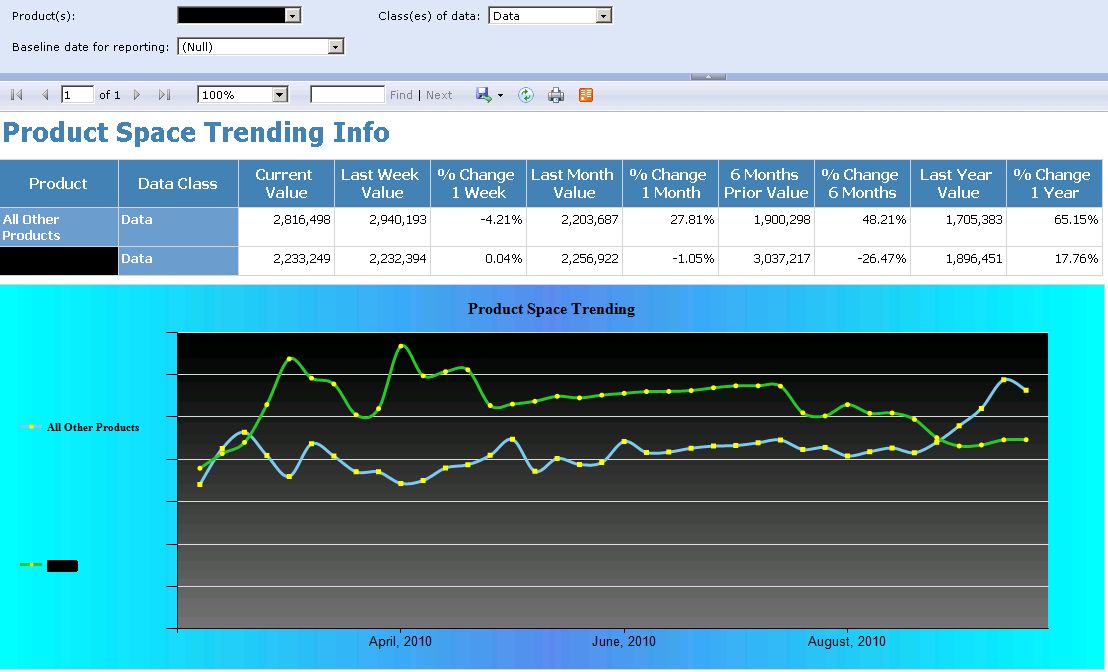
With all requirements accounted for it is simply a matter of implementing the attached Report Definition Language script, which points at the reporting database and presents the data as follows:
- Displays product growth trending for the input product(s), data class(es), and baseline reporting period (which is the current week if null)
- Graphically displays trending for the input product(s) and data class(es) over the past year
- Graphically displays a current snapshot of the total space on disk of the input product(s) and data class(es)
A sample execution of this report is shown below in Figure 3 using test data:

Figure 3: Sample execution of the SSRS report
With the SSRS report implemented all that remains is to define the delivery parameters. This can be done by using subscriptions in Reporting Services, which can be defined for execution of desired input parameter values and delivery to relevant management personnel (and possibly to internal product/project managers based on different input products) on a schedule of your (or more likely their) choosing.
Conclusions
The MDW provides a flexible, scalable solution to collecting and storing metrics across multiple SQL Server instances. The built-in collection sets provide a wealth of information that can be used for anything from performance troubleshooting to disk usage forecasting. In addition to these system collection sets the MDW also provides the ability to create and define custom collection sets, giving you even more control over the types of metrics you can gather (although this functionality is currently not available in the GUI and requires T-SQL scripting).
I hope that I have shown a practical, useful scenario in which the MDW can play a pivotal role in your data environment and possibly sparked some new ideas for taking advantage of everything this feature has to offer, both from an administrative and reporting perspective.


