An In-Depth Examination of Red Gate SQL Monitor v2.1
By Adam Machanic, SQLblog.com
Introduction
The choice of a quality monitoring solution is a key decision that every SQL Server shop must make. Although SQL Server is simple to set up and can often run without much intervention, it’s important to have a tool in place to help make sure that your instances are up and running, and to let you know quickly when problems do arise.
The market for monitoring tools has skyrocketed in the past several years, with a dizzying number of choices available across a large budget range. Each of these tools seems to have pros, cons, and a specific market niche, and some have gained a reputation for causing more problems than they solve.
One of the many available choices is Red Gate’s SQL Monitor v2.1, a new, completely revamped version of the earlier SQL Response. I evaluated SQL Monitor over the course of a month in order to determine its feasibility as a performance monitoring tool and to find both its strong and weak points.
Starting at $595 per server instance, the tool costs approximately one-third as much as similar tools offered by other competitors in the market. The user interface is completely Web-based, a welcome change from the heavier Windows clients that most products use—and an especially important feature for DBAs interested in monitoring from mobile devices. The functionality is basic but well thought out, with a decent set of built-in alerts and criteria that I can only hope will be greatly extended in future versions.
Overall I am quite happy with the product: It is lightweight, easy to set up and use, and is an effective monitoring solution for simple to moderately complex environments. Given its price point, I am quite comfortable recommending it as a solution for most SQL Server installations.
Below I’ll cover my experience with SQL Monitor, from installation through day-to-day use. I will attempt to highlight both what the product does very well and the areas in which things were somewhat less than ideal.
Getting Started: Downloading and Installation
The SQL Monitor trial ships in a 38MB downloadable ZIP file, along with trial versions of various other Red Gate SQL Server management tools. The actual SQL Monitor installer is an 8MB executable. The installer sets up data collection and Web user interface components. Nothing is installed on monitored SQL Server instances, and these instances are configured after the install process via the user interface.

Figure 1: Graphical view of SQL Monitor components.
SQL Monitor has three primary components:
- A base collector service that is responsible for collecting data from the monitored SQL Server instances. This is a standard Windows service.
- A data repository, which is a SQL Server database where the collected data will be held for later retrieval. This database can live on any SQL Server instance, including—up to size limitations—a SQL Server Express instance.
- A Web server, which is responsible for serving up the user interface. This server can be hosted in IIS, or can use a standalone Web server that ships in the SQL Monitor installer.
The installer has very few options, and these are based around configuration of the three primary components. The components can be installed on a single server, or you can choose to install each on a separate server, for a more scalable solution.
For my evaluation I installed all three components on a single test server and chose to use the standalone Web server, due to the fact that my test machine did not have IIS installed. Installation was extremely simple, problem free, and took me approximately five minutes to complete.
Setting up Monitored Servers
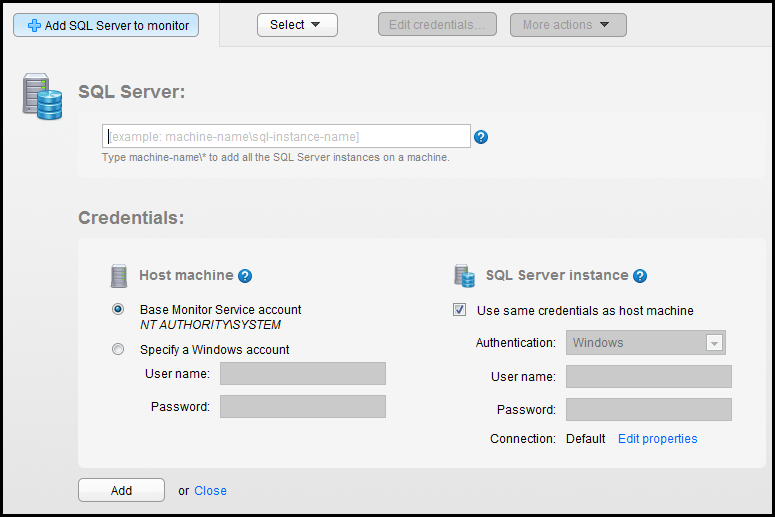
Once the product is installed the Web-based user interface becomes available. At this point target SQL Server instances must be registered before any actual monitoring can begin. Monitoring setup is, in theory, as easy as telling SQL Monitor the name of the target server and named instance (if applicable), plus providing credentials that should be used when connecting. While the UI (shown in Figure 2) is quite simple and straightforward—and I suspect things will be easier for most users—I had some issues during this phase of the process.

Figure 2: The server configuration screen.
SQL Monitor uses several different technologies to collect information about the health and state of your SQL Server instances. Transact-SQL queries are used, but so are Windows Management Instrumentation, Remote Registry, remote file access, and ping. When a SQL Server instance is registered with SQL Monitor, the tool attempts to establish various connections in order to configure monitoring. Unfortunately, if one of the connection methods fails—in my case, Remote Registry— a rather ambiguous error message is shown and no monitoring is started.
As a result of this occurrence I had the opportunity to evaluate an element of SQL Monitor that I didn’t expect to touch: its technical support team. I contacted the team via the Red Gate Web site and received a reply within 20 minutes with a link to . The support engineer and I exchanged numerous e-mails over a 90-minute period, during which he was very helpful in diagnosing and guiding me in fixing the problem.
The actual problem was fairly basic: the server I was attempting to monitor uses an alias name, and both Remote Registry and WMI work only using actual physical server names. This means that configuring SQL Monitor may be tricky for clustered server instances, which are almost always referred to by a single alias. For standalone servers there should be no issue as long as you’re aware of this caveat and remember to use the correct name to refer to your server. Either way, I’m happy to report that the technical support team seems both responsive and capable of helping to solve installation headaches.
Alerts and Notifications
The real value of a monitoring product is the ability for it to let you know when something is going wrong on your server. SQL Monitor 2.1 includes 28 different types of alerts, with configurable thresholds, to help you track down common problems. Alerts are grouped into two basic categories: SQL Server alerts, which are specific to the SQL Server instance itself; and host machine alerts, which are specific to the entire server and are collected via performance counters.
The SQL Server alerts cover a number of familiar situations including blocking, deadlocks, long-running queries, long-running SQL Agent jobs, index fragmentation, and cluster failovers. The product also includes various “overdue” alerts to let you know when database backups, log backups, or integrity checks haven’t been run recently. Finally, there are alerts to help you track when one of the SQL Server services has stopped running or is failing to respond.
The set of host machine alerts is a bit sparse, and includes alerts for high processor utilization, high physical memory utilization, and high disk space utilization. Not included here, surprisingly, is an alert for high disk utilization (which could be based on latency and/or other metrics), nor more advanced alerts triggered via less-common memory or processor metrics. Two alerts are included that I haven’t seen elsewhere: a clock skew alert to let you know when your system clock is getting out of sync, and a processor under-utilization alert which could be extremely useful for databases that are expected to be under constant load.

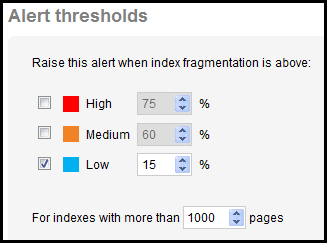
Figure 3: Configuration of index fragmentation alert thresholds.
Each alert can be enabled with up to three alert thresholds as shown in Figure 3: High, Medium, or Low. The thresholds are configurable based on the type of the alert. For example, the physical memory utilization alert can be configured to fire when the amount of used memory is higher than a certain percentage, or can fire when the available memory reaches a certain threshold in megabytes. The thresholds for the backup overdue alert, on the other hand, are configured based on a number of days since the backup was last taken.
In addition to configuring thresholds, each alert can be used as an e-mail notification. Alerts that are not sent via e-mail can still be viewed using the Web interface, so the product is quite flexible in terms of how you would like to collect information. I was at first surprised by the lack of SMS support, but after doing some research I discovered that most modern devices have e-mail addresses, so lack of direct SMS should not be a barrier to setting up a paging system based on SQL Monitor.
The alerts that ship with SQL Monitor have default thresholds that seem well thought out, and which cover the most common scenarios relatively well. However, the set of alerts is a bit under-populated in this version, and there is currently no way to add custom alerts to the product. I would also like to see greater flexibility in configuring some of the alerts; for example, I was unable to find a way to configure how often collection is done for each alert type. If you are, like me, the type of DBA who requires a tremendous amount of control, the alerting features in SQL Monitor may not be quite sufficient for your needs in the current version, but for most DBAs I think the included alerts are enough to get the job done.
Alert Data and Analysis
By far the most impressive aspect of SQL Monitor is its ability to collect and correlate performance data along with its alerts. The product collects information from 37 different performance counters and optionally from SQL Trace, all of which is made available in a rolling snapshot format along with alerts, in order to help with debugging more complex issues.

Figure 4: An overview containing information on server disk activity.
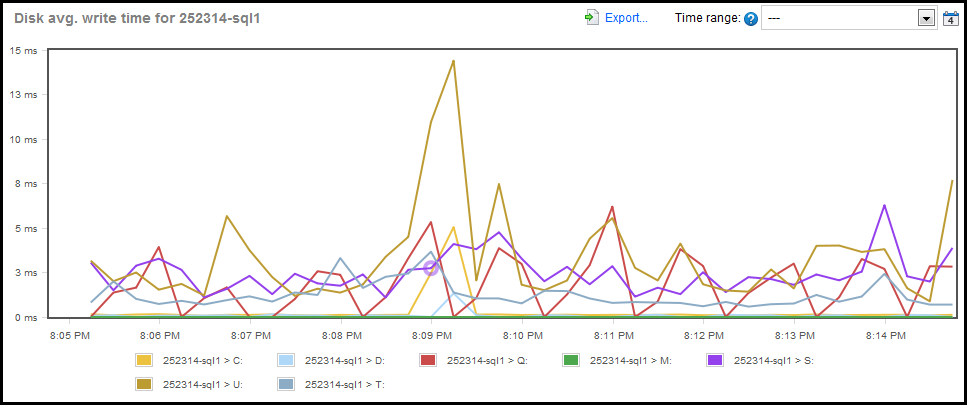
Performance data can be consumed in a number of forms from the Web interface. The main overview page for each server contains small graphs to all users to read key metrics at a glance. Figure 4 shows the disk activity on one of the SQLServerCentral Servers monitored systems. Clicking on these brings up Analysis mode, in which a much larger graph is displayed, along with the ability to render any time period for which you’re interested in finding out what happened. This mode is quite useful for determining what was going on with the server when a problem occurred. The only downside is that the product currently graphs only a single metric at a time, making correlation a bit tedious.

Figure 5: Drilling in to see more detail on server disk activity.
A big plus, especially for newer DBAs, is that each metric includes a comprehensive description, along with recommendations for best practices, areas to check for problems, and Web links for more information. This struck me as a very nice addition that will help users understand exactly why a given metric seems to be spiking, and what steps should be taken to debug the situation.
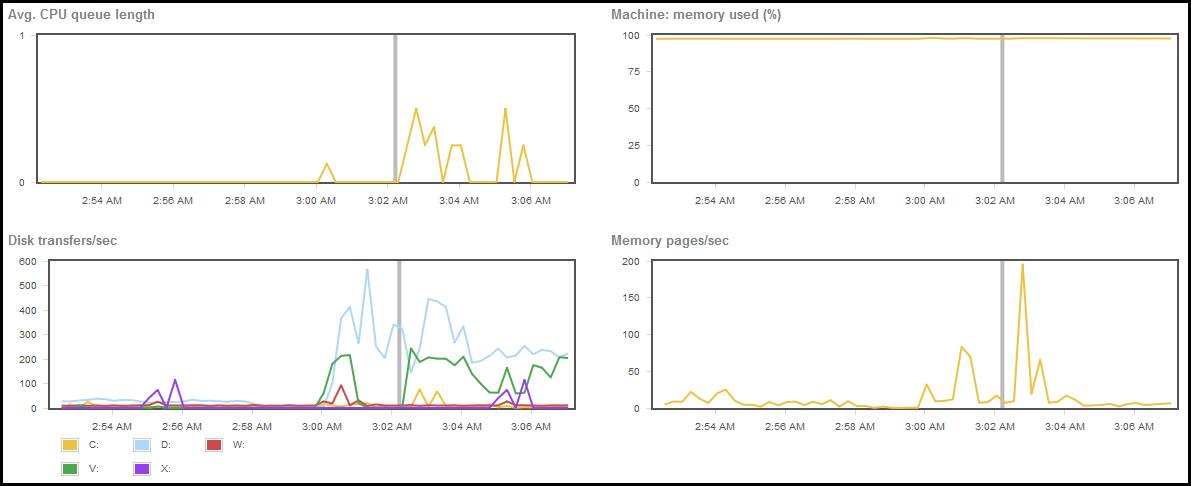
Performance data is also available along with alerts and a sample of what can be seen is shown in Figure 6. During my evaluation I used SQL Monitor on several occasions to help with diagnosis of long-running queries, and the ability to quickly determine the state of memory, processors, and the disk system proved to be quite handy in avoiding guesswork while figuring things out. Unfortunately, only six metrics are shown along with the alert, and the metrics are not configurable. In order to see more information it is necessary to move to the Analysis tab, which makes for a rather choppy user experience when action is necessary.

Figure 6: Some of the correlated data available with each alert.
Along with the alert and performance data, the alerts screen allows users to see the active system and SQL Server processes as of the time of the alert, and to see a running timeline of the alert as well as previous occurrences. Users can also store comments along with alerts, an absolute necessity for team environments.
SQL Monitor 2.1 includes an impressive user interface by which to explore alerts and the state of the server at the time of the alert. Future versions will, I hope, capitalize more upon the available data assist users with more in-depth examination and debugging directly through the Web interface.
Management on the Go: Tablet Devices
One of the key benefits of SQL Monitor is the fact that it uses a Web interface rather than a Windows client. This means that the product can be used on any number of devices, including mobile tablets such as the iPad. Red Gate has focused on this in its marketing campaigns for SQL Monitor, and looking at the product on a tablet device it is clear that a lot of attention was paid to making it work very nicely in mobile settings.
While SQL Monitor itself looks great and runs seamlessly on an iPad, I found the overall experience of doing server administration via the iPad to be a bit painful. The problem stems from the fact that while SQL Monitor will tell you that something is wrong, and may even help you pinpoint the exact issue, it can’t help you take action.
In order to do full end-to-end administration via an iPad you must first download one of the VPN/remote desktop clients available for iOS. For Citrix users, there is a free application available that supports XenApp. This works relatively well, but I do not recommend attempting to administrate your SQL Servers from the beach unless you’ve purchased an external keyboard. Typing through the iPad VPN interface is, to be honest, an exercise in extreme frustration.
If you are interested in remote administration, SQL Monitor is but one part of the puzzle. I’m not sure that the entire problem is completely solvable today, but the fact that SQL Monitor works and looks great in virtually any Web browser certainly helps take us a long way toward a general-purpose mobile administration solution.
Summary
SQL Monitor 2.1 is a well-designed, easy-to-use tool for basic SQL Server administration tasks. Installation and setup is, for the most part, quite simple, and the product includes enough alerts and data collection capability to help with monitoring servers for a variety of performance conditions. The tool’s inexpensive price-point—as well as its slick Web-based interface—make it an easy choice for DBAs who want to get the job done without the need for an extreme amount of control over a monitoring solution. The facts that the product is backed by excellent support, and that it is quite easy to use from mobile devices, further sweetens the deal.
It is clear from using SQL Monitor that a lot of thought and effort was put into its design, and although I found a few holes, it is obvious that the tool is built on a strong foundation. I am very much looking forward to seeing SQL Monitor grow and evolve into an even greater offering in future versions. In the meantime, I will not hesitate to recommend this product to DBAs looking for a simple, intuitive, and surprisingly cost-effective means by which to monitor their servers.
More information on SQL Monitor can be found at: http://www.red-gate.com/products/dba/sql-monitor/
SQL Monitor is used to watch the SQLServerCentral database server cluster. You can view the live data from those servers at www.thefutureofmonitoring.com and see how you can monitor a SQL Server instance without having to install any software on your device.
The SQL Monitor Forum on Red Gate’s website is open for comments and questions.
Editor’s Note: SQL Monitor v2.2 is due to be released on Feb 15th, 2011, and includes minor changes and enhancements


