What is Profiler?
Profiler is a GUI interface on top of the SQL Trace architecture. It is used to track activity on the selected SQL Server. In 2005 there are 171 different events that can be traced (this includes 10 user defined events). Each event makes available some, not all, of the 65 available columns. You can find lists of both events and columns at http://msdn.microsoft.com/en-us/library/ms186265(SQL.90).aspx.
Thanks to Yelena Varshal for providing that link in this discussion, http://www.sqlservercentral.com/Forums/Topic580078-1254-1.aspx.
Profiler is included with all versions of SQL Server, except SQL Server Express. Profiler can be used against all versions of SQL Server, and server-side tracing (to be covered in a later article) is available on all versions of SQL Server.
Security Considerations
In order to use Profiler a user must be granted ALTER TRACE permissions. ALTER TRACE is a server level permission which means that anyone granted this permission can trace ANY database on the server. This permission is new to SQL Server 2005, for earlier versions users must be in the sysadmin server role.
Profiler does not show passwords and keeps encrypted code hidden.
Why use Profiler
I find Profiler to be an invaluable tool in my toolkit. Among the many reasons I use it are:
- It is included with all SQL Server Editions (except Express)
- It is easy to use and has an intuitive user interface.
- To analyze and determine application behaviors. What is the application really sending to the SQL Server or is the application actually connecting as expected to the SQL Server? This is becoming even more important with the increased use of ORM tools like nHibernate, Linq to SQL, and Entity Framework.
- To performance tune. You can include reads, writes, duration, and CPU use to find the most expensive queries against your server or database. You can include locking and deadlock information (including a deadlock graph) and execution plans. You can also include Cache events to see if you are re-using execution plans as anticipated.
- To audit your server, although a server-side trace will be better for long-term auditing.
I can't count the number of times I have wondered, "How does SSMS (or other application) do that?", so I start up Profiler and do the task using the application and seen how it works under the covers. I have been able to automate many tasks because of what I have found using Profiler.
Starting Profiler
There are two ways to get to Profiler:
1. In default installation - Start->Programs->Microsoft SQL Server 2005-> Performance Tools
2. In SSMS under the Tools menu.
Creating and Configuring a Trace
Once you have opened Profiler you need to "Create a new Trace" either under the File menu or the new trace icon,  , on the left side of the toolbar. Once you decide to create a trace you will first be prompted to connect to a SQL Server (or Analysis Server)
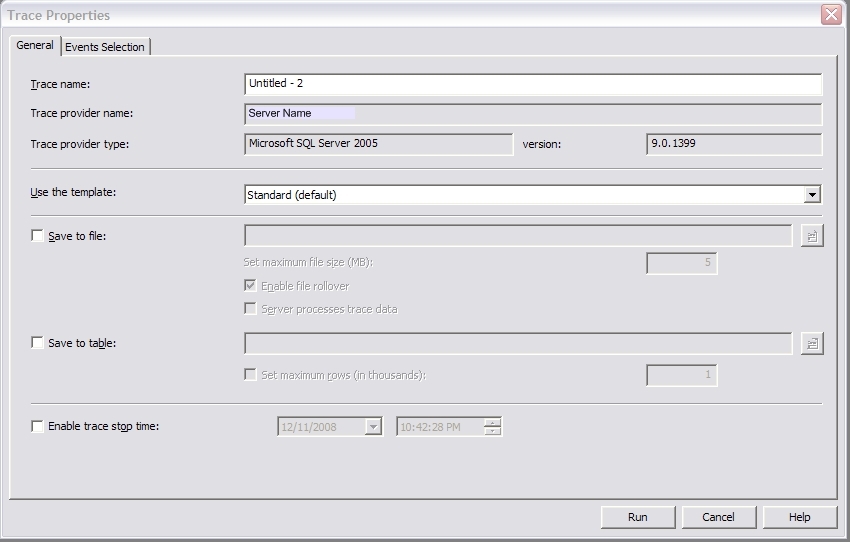
Select or type in the server name and click connect. You will be presented with the Trace Properties dialog:

Figure 1
Here are explanations of a couple of the least self-explanatory properties; for more information you can use Books on Line (BOL):
Trace Name:
A name to identify the trace running within the Profiler GUI. You can have multiple traces running at once.
Use the Template:
Lists a group of pre-defined traces that you can use as a baseline.
It is possible to create your own templates as well, which will then be available in this list. I'll cover this in a later article. You can look this up in BOL.
Save to file:
Server Processes Trace Data: if this is selected a second trace is created which runs on the server. The path you selected earlier must be a network location accessible by the SQL Server if this is selected.
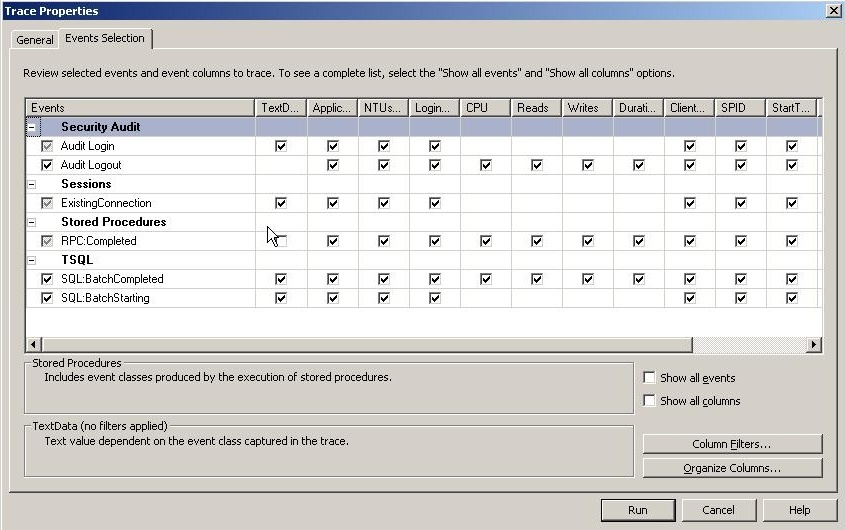
Next you need to choose the events you wish to trace and the columns you want to display. To do this click on the Events Selection tab. You will be presented with a screen similar to this:

Figure 2
By default this page shows only Events and Columns selected.
Adding Events
- Select the Show all events check box. Then you will have access to the 170 available events.
- Select each event you wish to trace. See BOL to find the details for each event. Notice that as you mouse over each event the text in the top pane in the lower area of the page changes giving you a short description of the event or event category. In the Figure 2 above it would be "Stored Procedures", the event category, and "Includes event classes produced by the execution of stored procedures".
- Once you have made your event selections, you should uncheck this to make column selection simpler.
Adding Columns
- Check the Show all columns check box
- Select the columns you wish to view; a shortcut for selecting the column for all events is to right-click on the column header and select "Select column". Notice the lower pane in lower area of Figure 2 above. It changes as you mouse over each column showing a short description of the column and in the header, if you have any filters on the column.
- Common Column choices would be (this will vary based on the reason for the trace):
- TextData
- ApplicationName
- NTUserName
- LoginName
- CPU
- Reads
- Writes
- Duration
- SPID
- DatabaseName
- ObjectID
- EventSequence
Column Filters
In order to limit the impact of your trace on the server you need to set up filters which will limit the data returned by the trace. When you use Profiler there is one filter setup by default on ApplicationName to filter out events raised by Profiler. If you click on the Columns Filters button you will see a screen like this (this list is also controlled by the Show all columns checkbox):

Figure 3
Notice, that it automatically shows the filter on Application name and you can see that it is applying a "Not Like" filter. The funnel icon will appear next to any columns that have a filter applied to them.
The "Exclude rows that do not contain values" checkbox is there because some events do not include all columns or because the data is not returned by that particular event. Thus checking this box will eliminate events that do not contain data in the selected column. Otherwise those rows will be returned. For example, if you were to run a trace with a filter on the NTUserName column and left this box unchecked then events created by a SQL Login, which do not populate the NTUserName column, will appear in the trace, but if this box IS checked these events will be excluded. In essence this would change the filter to "Where NTLoginName Like 'UserName' Or NTLoginName Is Null".
Organize Columns
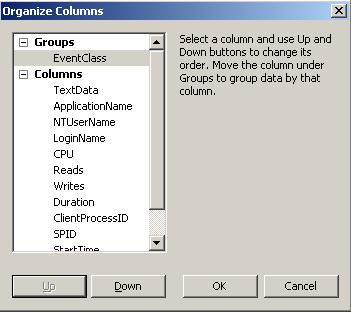
You can have the columns display in any order you like, and also group on specific columns. For example, in Figure 4 below:

Figure 4
I have moved the EventClass column into a Group. This will create a trace that looks like this:

Figure 5
Notice how there are no details showing, but that the data is collapsed up to each EventClass with the number of events collected in parenthesis. You can expand the details by clicking the "+" next to the EventClass.
Once you have selected the events and columns you want, you are ready to start your trace.
Running and Controlling a Running Trace
To start the trace click the Run button shown in Figure 2. Once the trace is running you can control it using the VCR-style buttons on the toolbar (Figure 6).

Figure 6
One of the first thing I do when I start a trace is turn off the Autoscroll functionality. You can do this using the Autoscroll button on the toolbar,  , or going to Window -> Autoscroll on the menu bar. The Autoscroll function caused the display to "jump" to the most recent event returned, and while this can be helpful if you are just watching what is happening, it can be annoying when you are attempting to find a specific event.
Editing a running trace
New to Profiler in 2005 is the ability to edit a trace while it is paused. Previously, if you wanted to edit a trace you would need to stop it, which would cause Profiler to discard the already collected data, but this new feature allows you to edit the trace without discarding previously collected data.
Conclusion
In this article we have presented a basic overview of what Profiler is, why you would use it, and how to use it. The next article in this series will introduce saving accumulated trace data and creating custom templates.
Resources
Microsoft SQL Server 2005 Unleashed
Inside Microsoft® SQL Server(TM) 2005: Query Tuning and Optimization
SQL Server 2005 Books On Line
http://www.databasejournal.com/features/mssql/article.php/3750161
http://www.databasejournal.com/features/mssql/article.php/3755911

