Introduction
Although SQL Server 2005 has been around for some time, I am sure the feeling of frustration of dealing with tempdb-related issues in earlier versions of the product is a vivid memory for many DBAs. As is the case with other system objects, tempdb in SQL Server 2000 is essentially a black box. Besides access to database-file-size and free-space information, breaking down tempdb utilization to contributions from individual components, such as internal and user objects, is a challenge. This information is vital if the DBA is to make informed decisions that target, on a case-by-case basis, the main culprits of tempdb growth. This all changes with SQL Server 2005. For an excellent discussion on tempdb in SQL Server 2005 I refer the reader to this white paper: Working with tempdb in SQL Server 2005.
Starting with SQL Server 2005, tempdb is used to store three types of objects: internal objects, user objects and version stores (new in SQL Server 2005). Internal objects store intermediate results from query processing operations, such as hash joins and sorts, as well as information related to cursors, INSTEAD OF triggers, the Service Broker and LOB variables. User objects include user-defined and system-catalog tables and indexes, table variables, table-valued-function return values and the mapping index if the SORT_IN_TEMPDB option is selected in online clustered-index builds. Lastly, version stores contain row-versioning information for features, such as snapshot isolation, online indexing, AFTER triggers and Multiple Active Result Sets (MARS). It is clear that an automated way is needed to sort through this wide array of data and target key contributions. This is where the present solution comes in.
SQL Server 2005 comes with three dynamic management views (DMVs) for probing tempdb usage at the instance, session and task level, respectively: sys.dm_db_file_space_usage, sys.dm_db_session_file_usage and sys.dm_db_task_space_usage. In addition to the three types of objects mentioned in the previous paragraph, a fourth type of utilization, mixed extent pages, is exposed by view sys.dm_db_file_space_usage at the instance level. Mixed extents consist of pages allocated to different objects (as opposed to uniform extents with pages dedicated to a single object). A high number of tempdb mixed-extent pages at any given time suggests that a large number of small tempdb objects (temp tables, table variables) is simultaneously being created and/or that there is high extent fragmentation in tempdb.
Here I combine time-sensitive information collected by the above DMVs with the power of SQL Server 2005 Reporting Services to create a tool that provides a visual representation of tempdb utilization, down to the task level, for multiple SQL instances and in an up-to-the-minute time frame. In fact, a Reporting Services installation is not even really required: the presented solution can be used from the comfort of one's Business Intelligence Development Studio (BIDS) environment, and, in fact, this is how I have created the figures for this article.
The inspiration of using SSRS to present information in real time and from multiple data sources in a "dynamic" user interface came to me from an article published in this site by Rodney Landrum some time ago: The Reporting Services 3-Trick Pony. Up to that point I saw SSRS simply as a tool of viewing "static" information, stored in a single repository that is refreshed at (mostly) infrequent scheduled intervals. The idea of using dynamic connection strings to selectively present data from multiple data sources, in graph format, and as events unfold, transformed Reporting Services, in my mind, to a powerful interactive tool with all the trappings of a full-blown web application, in which data is presented in ways that empower users to make timely and effective decisions.
The BIDS Solution
In the solution presented here, information is presented to the user is a highly dynamic manner that allows for the report palette to be occupied by information from multiple SQL instances, one instance at a time.
The layout of the report, as it appears in BIDS, is presented in Figures 1 and 2. The report consists of four main areas: a table listing the SQL Server instances of interest (left-most side of the screen); a group of textboxes (acting as buttons), each corresponding to a specific aspect of tempdb utilization (top, under the report title); the chart area (middle); and four tables (bottom) for showing detail information (Figure 2). The role of each of these features will become clear once we get to the Results section.
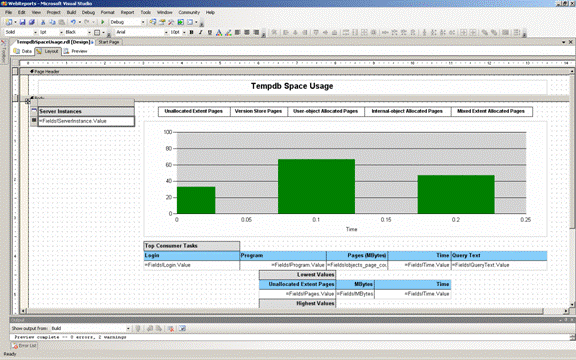
Figure 1. The layout tab (top part).
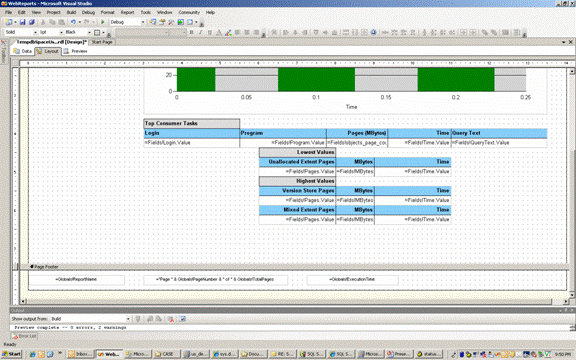
Figure 2. The layout tab (bottom part).
The Data area of the report is shown in Figure 3. The purpose of the ServerNames dataset (the one highlighted) is to populate the list of SQL instances monitored (left-most table in Figure 1). This information is stored in a central database, and is the only "static" connection in the report. The other five datasets, listed underneath ServerNames in Figure 3, populate the other areas of the report (as shown in Figures 1 and 2), and they are all "dynamic", in that they depend on a connection string that changes based on the choices of the report user.
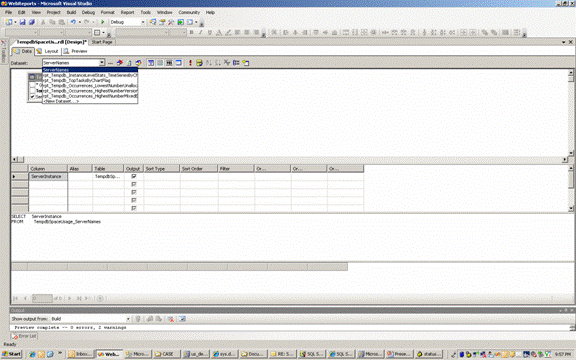
Figure 3. The Data tab.
The properties of a "dynamic" dataset, rpt_Tempdb_InstanceLevelStats_TimeSeriesByChartFlag, are shown in Figure 4. The query string is an expression that depends on the value of the chartFlag parameter. Report parameters are passed as input every time a report is refreshed as a result of a user action.
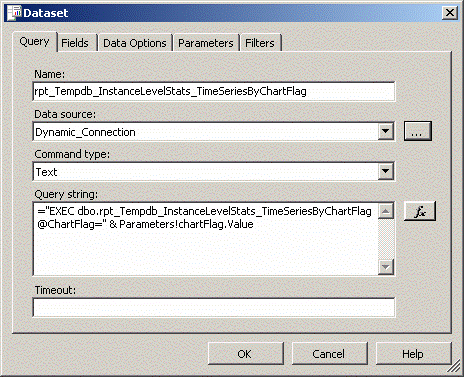
Figure 4. The rpt_Tempdb_InstanceLevelStats_TimeSeriesByChartFlag dataset
The Dynamic_Connection datasource is shown in Figure 5. The connection string depends on another report parameter: ServerName. This parameter represents the SQL instance selected from the list on the left-most side of the report area (Figure 1). Based on the user's selection, the connection string is dynamically constructed at run time and a connection is made to retrieve the requested data.
The 2 report parameters are shown in Figure 6.
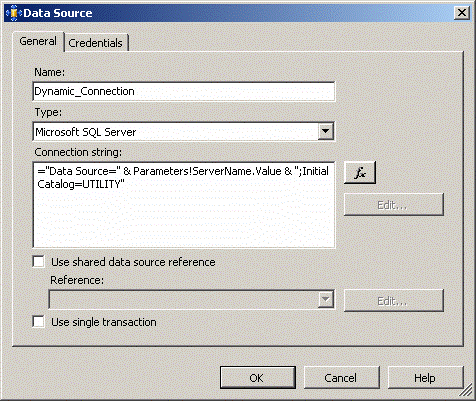
Figure 5. The Dynamic_Connection datasource
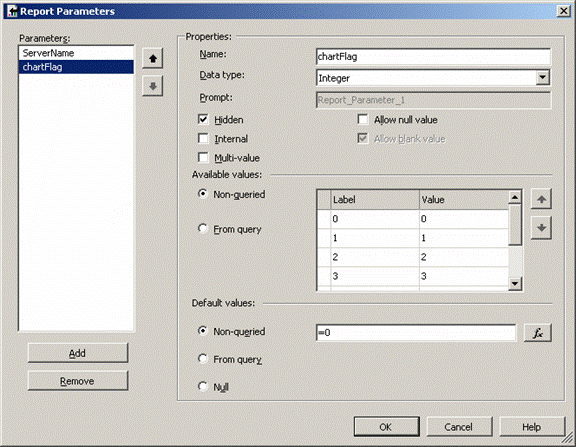
Figure 6. Report parameters
There are two regions in the report where the user is able to make requests on what data they want to see: the leftmost Server Instances table and the array of five textboxes/buttons right above the chart (Figure 1). These features essentially act as buttons/hyperlinks, in that they respond to the user's click action to refresh the report accordingly. The way this is accomplished is through the Action property. Figure 7 shows the configuration of the Action property for textbox ServerInstance. The Action property acts essentially as an event handler: it defines what should be done once the user clicks that textbox. In this case we instruct it to jump back to this report with the parameters shown in Figure 8 (obtained by clicking on the Parameters... button in Figure 7). The ServerName parameter obtains its value from the value of the ServerInstance box that the user click on; again, this will be more clear below, once an example is shown. Figure 9 shows the Parameters dialog of textbox VersionStorePagesBox (2nd button from the left at the top part of the report, Figure 7). Here, there are 2 parameters: the ServerName parameter which takes its value from that of the ServerInstance box (passed back to the report earlier as the ServerName parameter, as a result of the user clicking on a ServerInstance box, Figures 7 and 8); and the ChartFlag parameter, a value from 1-5 for each of the five "buttons" above the chart area (Figure 1).
 Figure 7. The Action property of textbox ServerInstance
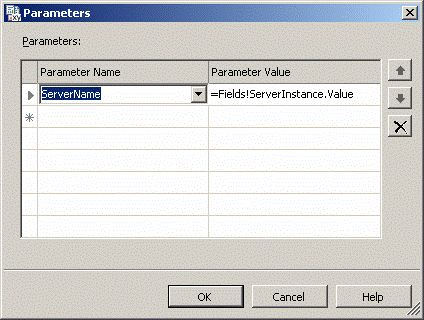
Figure 8. The Parameters dialog of the Action property of textbox ServerInstance
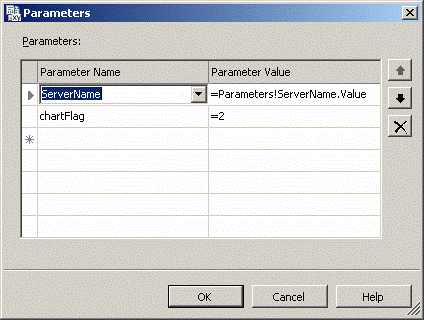
Figure 9. The Parameters dialog of the Action property of textbox VersionStorePagesBox
Figure 10 shows the Data tab of the Chart Properties dialog box, where the name of dataset rpt_Tempdb_InstanceLevelStats_TimeSeriesByChartFlag is specified. This is the dataset that supplies the chart data and was briefly described in Figure 4.
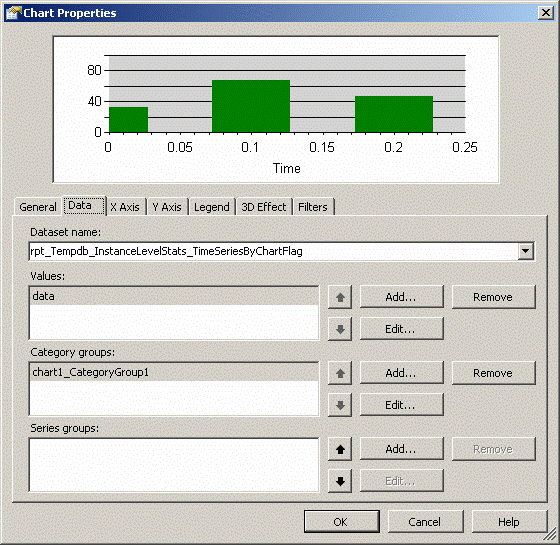
Figure 10. The Data tab of the Chart Properties dialog box
The Code
The report data is generated by two SQL jobs, running on every monitored instance: DBA - Tempdb Usage - Monitor and DBA -Tempdb Usage - Calculate Stats, Prune Tables. Job DBA - Tempdb Usage -Monitor runs every minute and collects the information presented in the report. Job DBA - Tempdb Usage - Calculate Stats, Prune Tables runs once an hour and performs two tasks: first, it calculates the mean and standard deviation values of the version-store and mixed-extent data distributions; second, it prunes data older than 24 hours.
Job DBA - Tempdb Usage -Monitor executes stored procedure Tempdb_SampleSpaceUsage, that is based on code I first saw on this link: Working with tempdb in SQL Server 2005. Tempdb_SampleSpaceUsage polls system views sys.dm_db_file_space_usage, sys.dm_db_session_space_usage, sys.dm_db_task_space_usage and sys.dm_exec_sessions and stores instance-, session- and task-specific tempdb-usage data in corresponding tables. It is this information that is then fed to the report chart (see Figure 1 and Results section below).
In addition, Tempdb_SampleSpaceUsage checks whether the current number of version-store or mixed-extent pages has exceeded 5 standard deviations above the mean value (calculated once an hour by job DBA -Tempdb Usage - Calculate Stats, Prune Tables. If that is the case, stored procedure ExecRequests_Poll is executed and information about the current execution requests and sessions is stored in table ExecRequests for later analysis.
The reason for calculating the mean and standard deviation of the version-store and mixed-extent page distributions and for polling the current execution requests if a threshold is exceeded is simple: the sys.dm_db_session_space_usage and sys.dm_db_task_space_usage views provide information on user-object and internal-object page utilization, but not for version-store and mixed-extent pages at the session and task level. I therefore had to get this type of information directly by polling the sys.dm_exec_requests and sys.dm_exec_sessions views whenever "something interesting happened": when the current values exceeded a predefined threshold. At the same time I did not want to be inundated with data, so I chose to poll the current exec requests only when warranted.
Results
Figure 11 shows the opening screen of the report. Here I am monitoring five database-engine instances, which I have aliased for the purposes of this article as alpha, beta, gamma, delta and epsilon. Viewing the various aspects of tempdb utilization is made possible by the five buttons at the top. By default, the selected instance is alpha, but a different instance can be chosen (and the corresponding "button" will be highlighted in yellow accordingly).
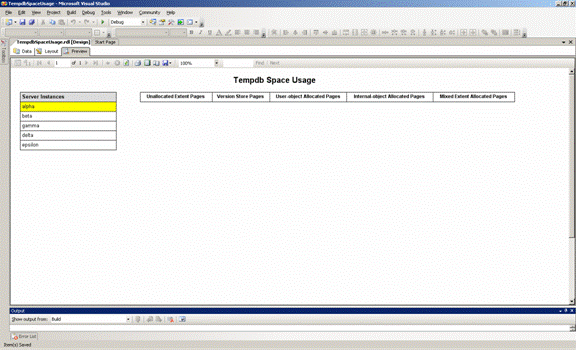
Figure 11. Opening screen
Figure 12 is showing the number of unallocated (empty) tempdb pages for instance epsilon over a period of 24 hours. In our production environment we allocate a large amount of disk space to tempdb data files to guard against unexpected surges in tempdb utilization (due to suboptimal queries, for example). In this particular case the total number of pages allocated is close to 50,000,000 (or 40 GB). The small dents visible at the top of the curve are due to tempdb usage events that occurred during the monitoring time frame. The table below the graph lists the lowest values of unallocated pages (where utilization is highest) and the times at which they have occurred.
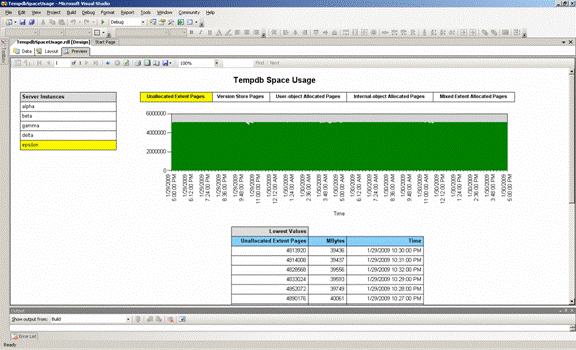
Figure 12. Unallocated tempdb extent pages for instance epsilon
Determination of the individual contributors to tempdb usage can be made by clicking each of the other four buttons. Figure 13 is showing the Version-Store-Pages profile of instance beta. As in the case of total unallocated pages, the table below the chart is showing the top outliers and times at which they took place.
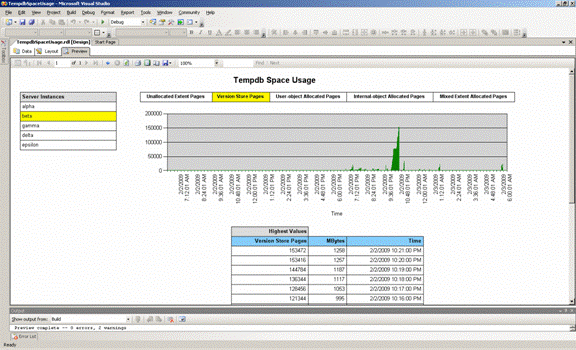
Figure 13. Version Store Pages for instance beta
User-object and internal-object allocated pages for instance beta are shown in Figures 14 and 15, respectively. As discussed above in the Code section, identification of the sessions and tasks consuming most of the user- and internal-tempdb-object pages is straightforward through system views sys.dm_db_session_space_usage and sys.dm_db_task_space_usage. This is why, unlike in the case of version-store (Figure 13) and mixed-extent pages, the actual top consuming tasks are explicitly shown in Figures 14 and 15. The main contributor in Figure 15 is a re-indexing job, but it could have easily been a query originating from a user application. In the past we have detected such queries, consuming tens of GB of tempdb space, and have subsequently reduced this utilization through proper indexing and code revisions.
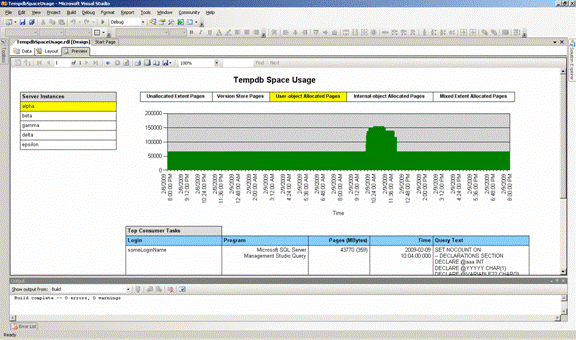
Figure 14. User-object allocated pages for instance alpha
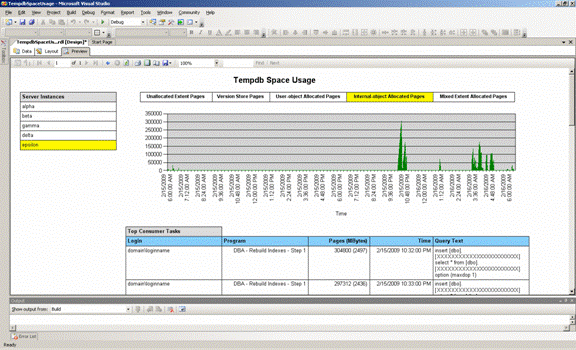
Figure 15. Internal-object allocated pages for instance beta
Discussion and Conclusions
Knowledge of the top tempdb-consuming processes and their times of occurrence is an essential goal of any general database-performance monitoring plan. Reducing tempdb utilization by targetting top consumers can result in overall lower disk I/O, better optimized queries and a generally more responsive and more scalable database application.
The proper in-advance sizing of tempdb files can favorably affect application performance by: (i) preventing application timeouts that occur when a tempdb file grows in response to an increased space requirement by a user process; (ii) helping eliminate the physical fragmentation of the tempdb files, an unavoidable by-product of file autogrowth, especially in situations where disk space is shared by non-tempdb files. It is not always feasible (or advisable) to try and prevent these adverse effects by pre-emptively allocating huge amounts of disk space (in the tens of GB) to tempdb files, whether or not it will ultimately be needed. Knowledge of the actual tempdb space required while an application is subjected to production-like workloads in a testing environment can help to more efficiently pre-allocate the appropriate disk space to tempdb before the application is rolled out to production. In cases of applications that have already been active in production for some time, prolonged monitoring of tempdb utilization can help DBAs and storage engineers pinpoint those SQL instances with in-excess tempdb allocated space, in the end making possible the more effective redistribution of these excess disk resources in other areas of the IT infrastructure. Figure 12 shows this to be an issue in our environment as well.
Given the additional tempdb-utilizing components (in the form of the version store) available in post-SQL-Server-2000 versions, knowledge of application-specific contributions to tempdb usage can be especially helpful in upgrade initiatives. An obvious culprit is the heavy use of triggers. In our organization we rely extensively on triggers for auditing of data modifications, and some of our largest systems have yet to be upgraded from SQL Server 2000. Triggers do not make use of tempdb in SQL Server 2000, whereas they do in subsequent versions of the product. The tool presented in this article will help us get a reliable estimate of the additional tempdb resources needed once we upgrade our development and test environments to SQL Server 2005/2008. Armed with this knowledge, we will be able to size the tempdb files appropriately for the given application workload, hence minimizing the risk of tempdb-out-of-space "surprises" once the upgrade is finally rolled out to production. Should we also decide to switch on additional "new" features, such as one of the snapshot isolation levels, the tool will make it easy to determine the size of this extra contribution to the tempdb storage and help us plan accordingly while still in the testing phase of the application lifecycle.
It is important to note that the presented solution is beset by a couple of limitations. First, sub-minute processes cannot be detected accurately, as the monitoring job runs once a minute. These "fast" processes are far less likely, however, to end up being major tempdb consumers. Second, because of the way the underlying system DMVs are designed, session and task-level information is not readily available for version-store and mixed-extent page usage. I have been able to obtain this type of information by inference only, through polling the sys.dm_exec_requests view once utilization exceeded a statistically defined threshold. A costly trigger in one of our applications has been identified using this approach and some puzzling results shared on this forum (see Costly update trigger -70000000 logical reads for 30000 rows updated! and High count of version-store pages in tempdb)
Although the importance of proper tempdb sizing is well documented and understood (see, for example, Capacity Planning for tempdb), it is challenging to come up with an automated monitoring plan that exposes top tempdb consumers down to the individual session and task level, in real time and in a convenient visual format. The application described in this article achieves these goals by combining the wealth of existing knowledge with much improved system-diagnostics and Reporting-Services features in versions post-SQL-Server-2000. My hope is that this will prove to be an indispensable tool for many others besides me and for some time to come.
Note on deployment and the BIDS 2008 version
The BIDS 2005 solution with the accompanying SQL code, plus deployment instructions, is attached as SuppMaterial.zip. I had an unpleasant surprise when trying to open the solution in BIDS 2008. Not only is the Report Designer layout different in BIDS 2008 (vs. 2005), but the chart was rendered as blank (no data) in Preview mode! (It also appears that BIDS 2008 makes some irreversible changes to the BIDS 2005 solution, so I would strongly advise people to save their BIDS-2005 version in a separate location before opening it with BIDS 2008). After some experimentation I managed to find the culprit (highlighted in Figure 16): the minimum-value setting in the chart category-axis (time-axis) properties dialog was set to 0 in the BIDS 2005 solution, but that did not prevent the chart from displaying properly in that case; setting it to "Auto" in BIDS 2008 fixed the issue. I expect this to be a cause of grief for people trying to upgrade their BIDS-2005 chart-containing solutions to BIDS/SSRS 2008.
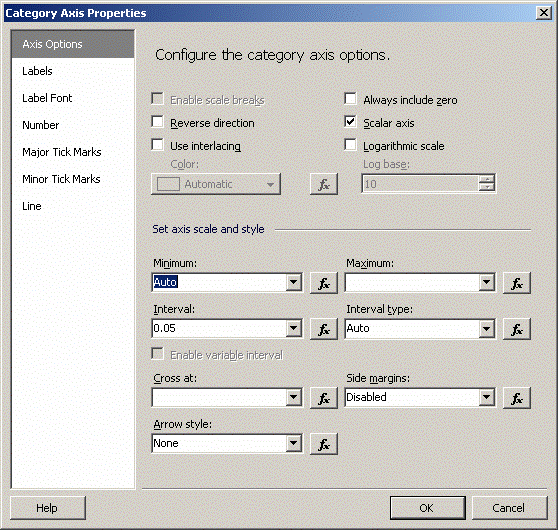
Figure 16. Category axis properties of chart in BIDS 2008


