Note: I’ve been meaning to start a series on the basics of SQL Server Reporting Services (SSRS). The last time I did this was on a book on SQL Server 2012 Reporting Services published by Packt. SSRS has since evolved into a better reporting platform with the addition of KPI’s, mobile reports, etc.
This is the Part 2 of our SQL Server 2017 Reporting Services (SSRS) Basics Series. You can find Part 1 here. We are going to create our first report – a basic Table Report. Before we do that, you should have the following tools installed on your local machine or laptop:
- Visual Studio 2017 Community Edition with the Microsoft Reporting Services Project Extension;
or SQL Server Data Tools (SSDT) for Visual Studio.- Wide World Importers Sample Database.
These are the basic tools we need to create our first report in SSRS. You actually have two (2) basic options for designing reports: Visual Studio Report Designer (see above) and the standalone Report Builder which you can download here. We are using Visual Studio in this series. You can explore other tools for authoring reports here.
Basic Components of a Report
First thing first: There are three (3) basic components of a report. These are Data Source, Dataset, and Report Definition Language (RDL) file.
- Data Source – In SSRS context, the data source is where your data is coming from. In our case, it is the local instance of SQL Server 2017. The data source includes connection string, data provider, and the credentials for accessing the source.
- Dataset – We define a dataset in SSRS with a query command. The result set returned by our query will be displayed on our table report.
- Report Definition Language (RDL) File – RDL is a dialect of Extensible Markup Language (XML). The report itself is in the form of this XML-like language. Don’t worry if you do not know how to write RDL. The report designer will translate our report components into RDL behind the scene so we don’t have to do that ourselves.
Shared Components
You have two (2) options on how to utilize the Data Source and Dataset: Shared or Embedded. The difference between
A report with an embedded data source and dataset will work right off the bat when uploaded in the report server without explicitly telling the report service what data source and dataset to use. If you have a separate, shared data source and dataset, you have to explicitly tell the report service which data source and dataset are used for the specific report. In this series, we are going to use a shared data source and dataset.
Basic Table Report
Let’s create our first report – a basic table report. Fire up your Visual Studio. Create a new project called SSRSTutorial_001 or any name you prefer. Use the Report Server Project template provided by Visual Studio. Click OK.
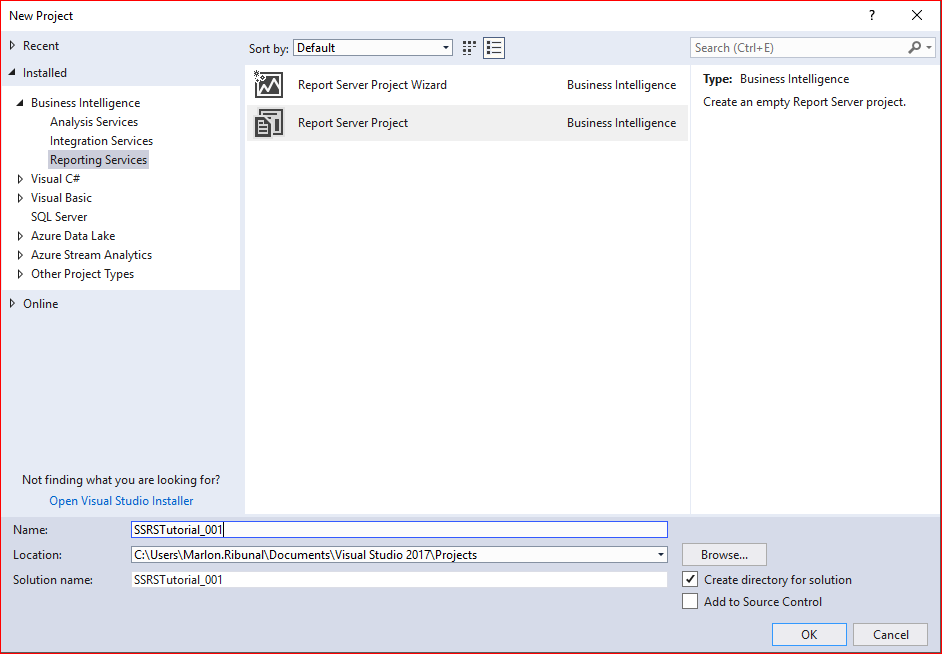
That should open Visual Studio designer. We’re going to create the components in this order: Data Source, Dataset, and Report Definition Language (RDL) file.
Data Source
In the Solution Explorer window (Press CTRL+ALT+L if the window is not showing, or Menu > View > Solution Explorer), right-click the Shared Data Sources folder and select Add New Data Source. That will display the Shared Data Source Properties dialog box.
In the Name field, let’s input DS_SSRSTutorial_001. Select Microsoft SQL Server for the source Type (should be the default).
Click the Edit button in the Connection String. That should bring up the Connection Properties dialog box. The Microsoft SQL Server (SqlClient) should be good for the data source and we’ll leave it like that. Leave the Authentication as Windows Authentication.
For the Server Name, input localhost./” (without the quotes) to point to our local instance of SQL Server. Select the WideWorldImporters database. Click the Test Connection button to make sure you’re connecting to the source. Click OK. There is no need to set the Credentials because we are using Integrated Security with Windows Authentication. Click OK. That will create our Shared Data Source (.rds file).
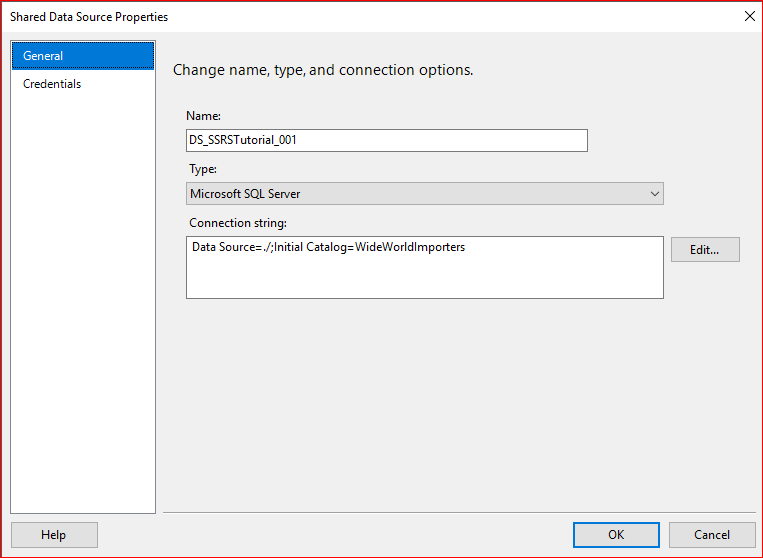
You may notice that the Connection Properties dialog created the Connection String for us.
Dataset
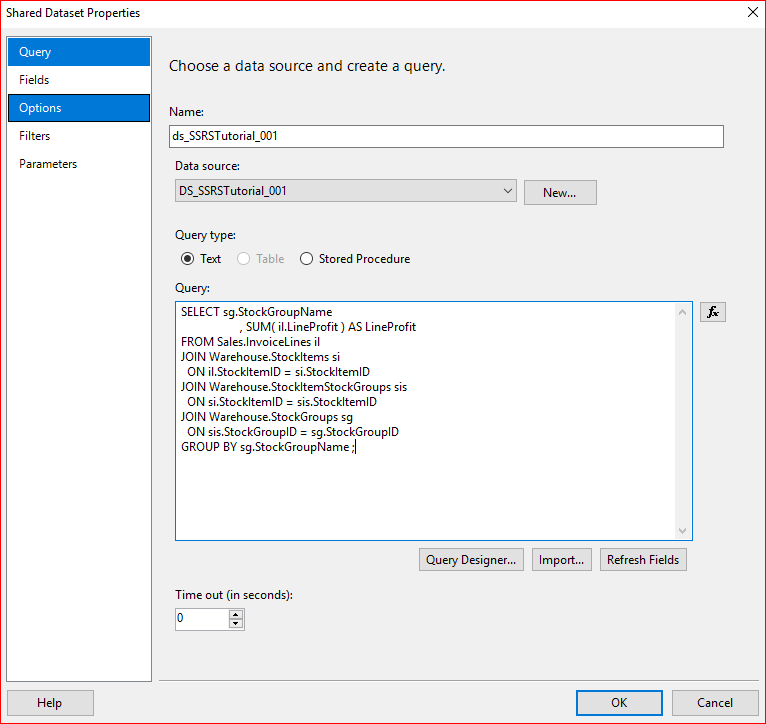
Creating the dataset is similar to how we created the data source. Right-Click the Shared Datasets folder in the Solution Explorer. and select Add New Dataset. Let’s name it ds_SSRSTutorial_001.
For the Data Source, select the data source we just created above, DS_SSRSTutorial_001 . It should be selected by default because it is the only data source created in our project at this point.
Select Text for the Query Type. Let’s borrow the dataset I used in my Creating Bar Graph In SQL Server 2017 Using R post. Copy and paste the following TSQL Code into the Query box, then click OK.
SELECT sg.StockGroupName
 , SUM( il.LineProfit ) AS LineProfit
FROM Sales.InvoiceLines il
JOIN Warehouse.StockItems si
  ON il.StockItemID = si.StockItemID
JOIN Warehouse.StockItemStockGroups sis
  ON si.StockItemID = sis.StockItemID
JOIN Warehouse.StockGroups sg
  ON sis.StockGroupID = sg.StockGroupID
GROUP BY sg.StockGroupName ;
Report Definition Language File
Now we’re ready to create our first basic table report. Right-Click the Reports folder in the Solution Explorer. Your instinct is probably select the first option in the context menu, Add New Report. But the option runs the Report Wizard. We’re going to skip the wizard and create a report from scratch. Select Add > New Item. That will display the Add New Item dialog box. Select the Report template and name the report rdl_SSRSTutorial_001. Click Add.
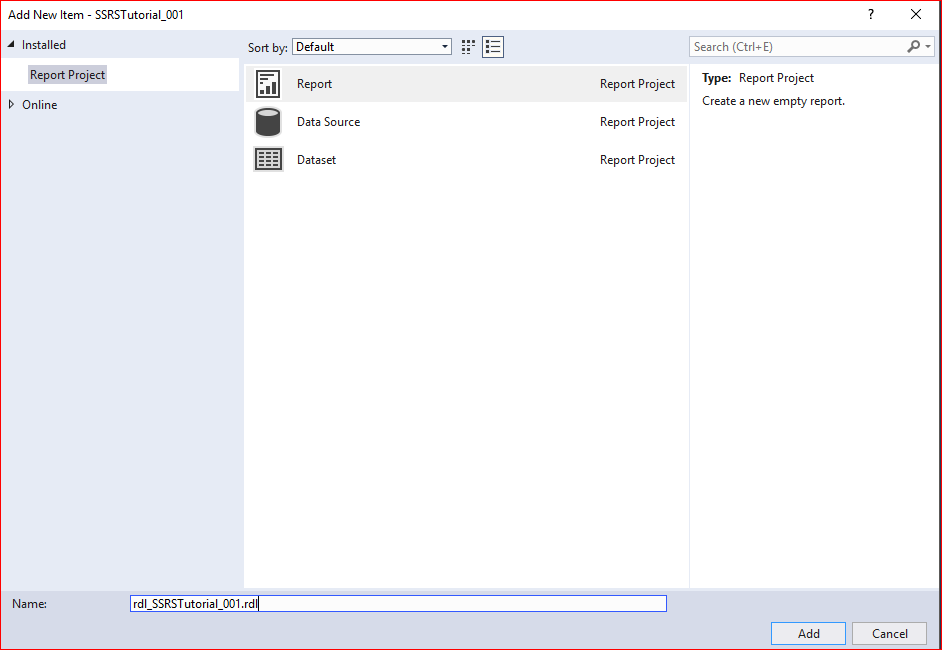
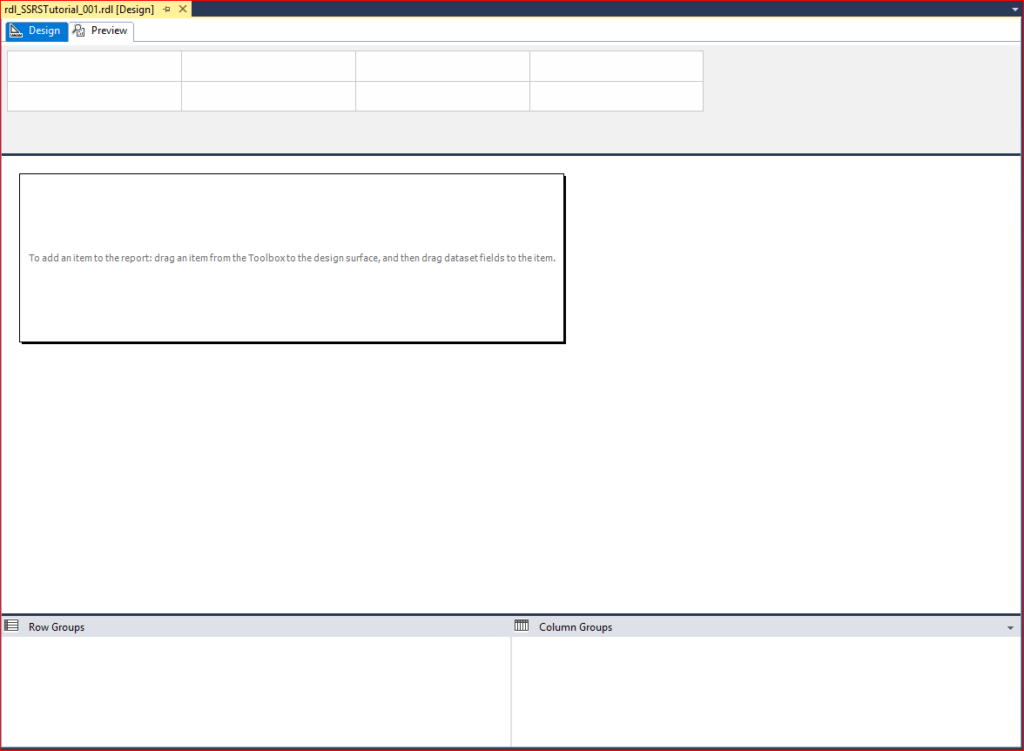
You should now see the Report Designer with an empty canvas in your Visual Studio.
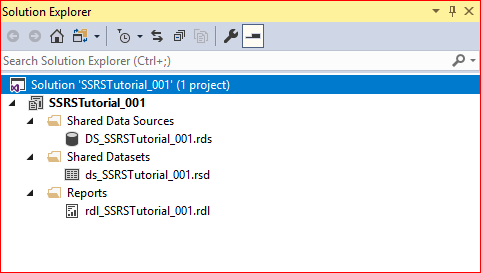
At this point, you should now have the three basic components in your Solution: Data Source, Dataset, and Report Definition.
Design the Report
Let’s design our report. Drag the Table component from the Toolbox window into the empty report canvas. If the Toolbox window is not showing, press CTRL+ALT+X. Or you can open it from the Menu > View > Toolbox.
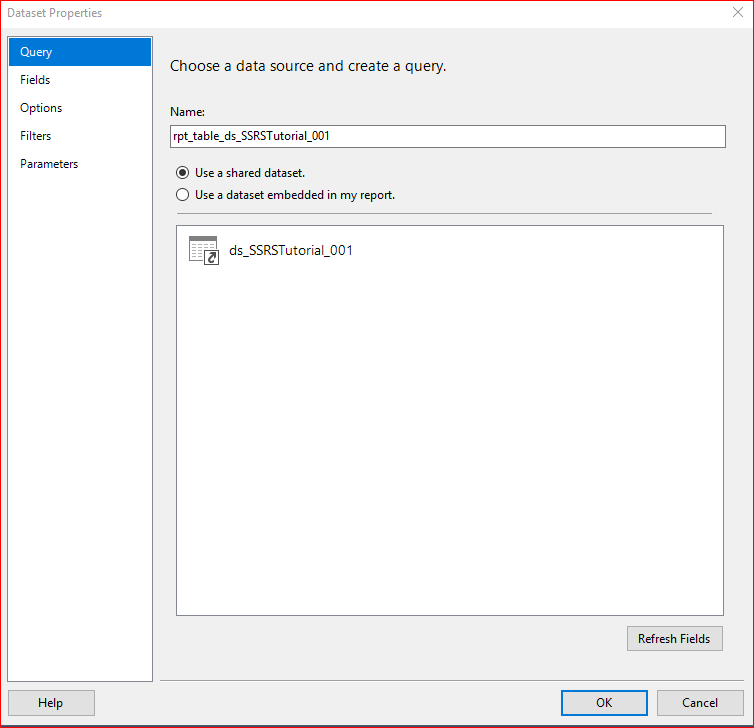
Dragging the Table component into the canvas will display the Dataset Properties dialog box. Let’s name our report dataset as rpt_table_ds_SSRSTutorial_001. Tick Use a Shared Dataset radio button; and select the dataset we created above, ds_SSRSTutorial_001. Click OK.
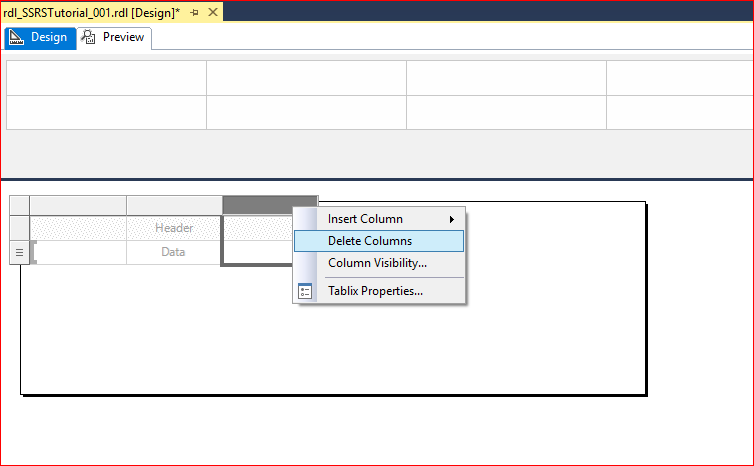
Click on the table to show the bar around the table designer. Right-Click the bar on top of the header on the third column, then select Delete Columns. We don’t need a third column for now.
Place your cursor in the data cell in the first column. That will display the little Table icon in the top corner of the cell. Click the icon and select StockGroupName.
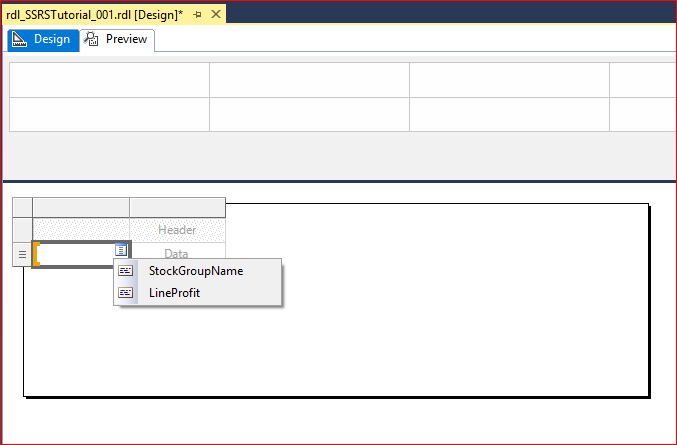
Do the same for the other cell and select LineProfit.
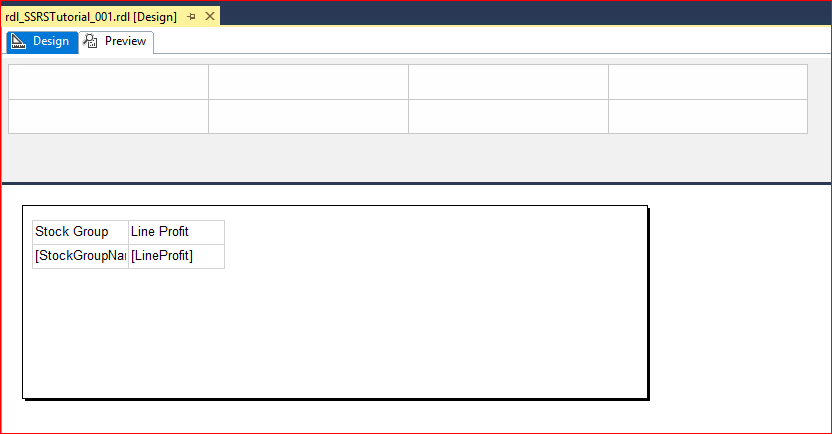
The report designer should now display something like this:
Click the Preview tab to display the preview of our report:
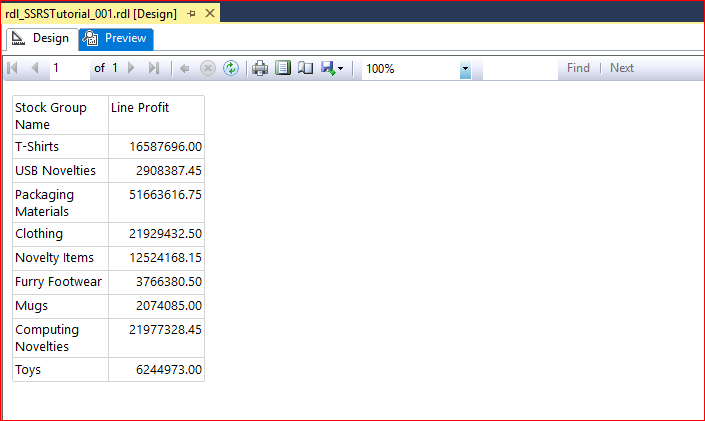
And there you go. You just created your first basic table report. In the next post, we will deploy this report to our report server. Stand by.
The post SQL Server 2017 Reporting Services: The Basics Part 2 appeared first on SQL, Code, Coffee, Etc..


