When Microsoft introduced Extended Events (XE) in 2008, they also gave us a built-in XE session called system_health (though it’s worth noting that in 2008 MS hadn’t yet provided us a GUI for this so it becomes most useful in 2012 and beyond).
This is a great little tool. I mainly use it for troubleshooting deadlocks as it logs all the information for any deadlocks that occur. No more having to mess about making sure specific trace flags are enabled to ensure deadlock information is captured in the error log.
It also captures the SQL text and Session Id (along with other relevant data) in a number of other scenarios you may need to troubleshoot:
- Where an error over severity 20 is encountered
- Where a session has waited on a latch for over 15 seconds
- Where a session has waited on a lock for over 30 seconds
- Sessions that have encountered other long waits (the threshold varies by wait type)
There are other events captured too, you can see the full list here:
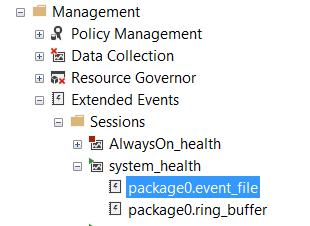
You can find the system_health session here in SSMS under your server instance:

Just double click on the event file to view historical data.
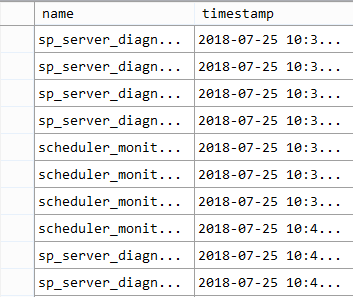
The view that comes up immediately can seem non-intuitive to work with (do I just have to scroll through thousands of events looking for the one I want?):

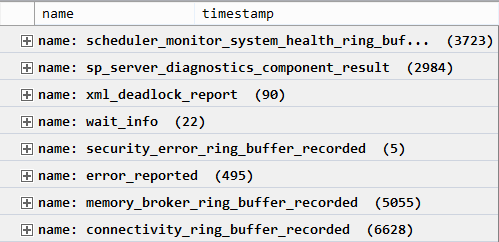
If you know the type of event you are looking for though, you can right-click on the “name” column and select the option to group by the values in that column. Then you see something more like this:

With the example of looking at deadlocks (what I mostly use this for) I can then just expand that group and look for the one I want.
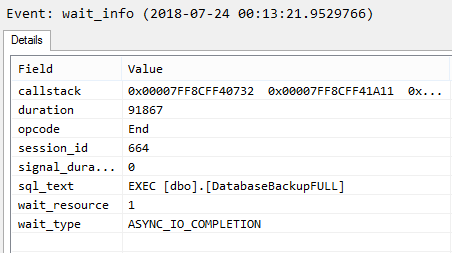
Or you can right-click and use “Find in Column” – or “Choose Columns” to add extra columns you might want to search in. For instance, I might want to see if it’s captured any information about why my backups are being delayed so I can add the “sql_text” column, order by that and then search for “backup”:

Once an event is selected it will show me the additional information gathered in the bottom pane:

Like I say, it’s pretty useful. My only issue is that by default it captures only 20MB of data, which on a busy system can mean events are only kept for a couple of days. So, I often want to increase the retention. I find the easiest way to do that is to right-click on the session and select “Script as CREATE to New Query Window”. I then edit the script to change the number of roll-over files to 20 (from 4):

You can then delete the existing system_health session and re-create it from the script – you do have to remember to right-click on it in the GUI and start it again.
One great thing is that when you do this is that you don’t lose the events already saved to file, as the files are retained and continue to be accessible from your newly created session.
All in all, a handy little tool.


