A couple of weeks ago, I encountered a DAX question that I had not previously considered. They had a situation where there were two paths between two tables: on direct between a fact and dimension and another that went through a different dimension and a bridge table. This could happen in many scenarios:
- Sales: There is a salesperson who is directly responsible for a sale. Sales leadership in various positions also get credit for that sale based upon the client or region to which the sale is associated, and this may logically be a many:many relationship (multiple people get credit for the same sale and a person gets credit for multiple sales).
- Consulting: Hours are worked and billed by a consultant, but the team lead(s) or tech lead(s) associated with each project also get some sort of credit or responsibility for all hours or invoices on a project.
- Law firms: An attorney works directly on a matter and bills for that time. Billing attorneys approve the timesheets or other attorneys get some sort of credit/commission on the work based upon a relationship to the matter.
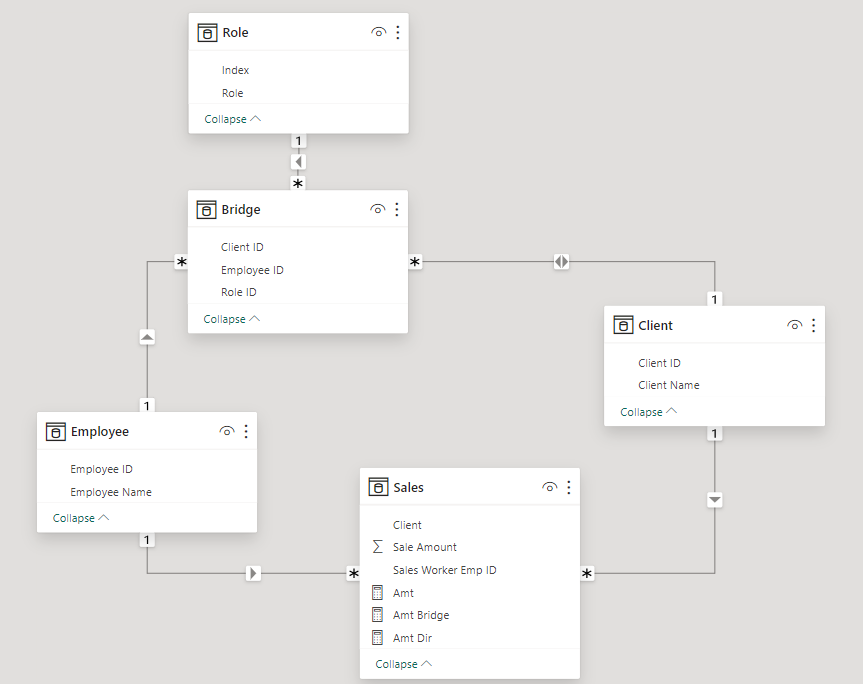
This scenario creates a data model similar to the below (I went with the sales example here). There is a direct relationship between Sales and Employee. On the sale, that related employee is the person who directly made the sale. But there are others who are associated with that sale because they have some sort of ownership of the client relationship. In this situation, it’s not just the manager of the salesperson – there could be a matrix where several people are involved. To accommodate this, we have a bridge table that relates the client dimension with the employee, and role dimensions. The role dimension might define the role as sales region lead or sales VP or sales product lead, and there might be multiple people in each role.

It’s very common to have role-playing dimensions, where the fact table has multiple columns that can relate to the target dimension. We set one as active and the other as inactive, and we can then use the USERELATIONSHIP() function with CALCULATE().
But this situation is different because it’s not about two direct relationships between two tables. In one path, we are going directly between Sales and Employee. In another path, we go from Sales through Client and Bridge to Employee. As you can see in the image, Power BI allows both of these relationships to be active at the same time. We can still use DAX to switch between the two, but we need to use different functions.
The Data
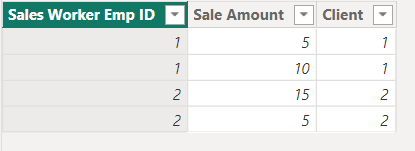
In my sales table, I have 4 rows:
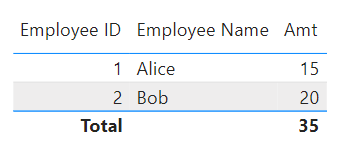
There are 4 sales. Two sales are related to client 1 and two are related to client 2. Employee 1 made $15 in sales. Employee 2 made $20 in sales.
By default, if I create a table with the sales amount and the employee, it will use the direct relationship between Sales and Employee.
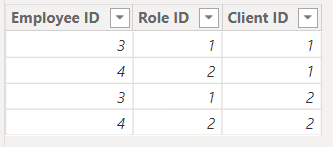
Employee 3 and Employee 4 have relationships to both Client 1 and Client 2 in the bridge table.
The bridge table has a bidirectional relationship with the Client table, and the Employee table has a single-direction 1:many relationship with the bridge table. When we use this path between the tables, we expect Employee 3 and Employee 4 to each have associated sale amounts of $35.
The DAX
I originally wasn’t sure if this could be done. I tried using TREATAS() to switch relationships, but that wasn’t enough to ignore a physical relationship. But I asked around and Ed Hansberry provided a solution using CROSSFILTER().
I started by creating a base measure:
Amt = Sum('Sales'[Sale Amount])
I created the following measure to use the bridge table:
Amt Bridge = CALCULATE([Amt],CROSSFILTER('Employee'[Employee ID], 'Sales'[Sales Worker Emp ID], None))
While I could have just used the [Amt] column for the direct relationship, I tested a measure that is more explicit in ignoring the relationship between the Employee and Bridge tables.
Amt Dir = CALCULATE([Amt], CROSSFILTER('Bridge'[Employee ID], Employee[Employee ID], NONE))
Again, this produces the same result as just using the original [Amt] measure.
CROSSFILTER() was exactly what I needed to accomplish my goal. Setting the CrossFilterType argument to None allows me to ignore an existing active physical relationship when used as a filter inside of CALCULATE().


