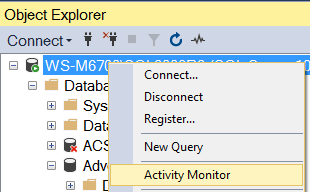
SSMS provides an Activity Monitor, a process that displays various information about what all is going on with the instance. This is available by right-clicking on the server and selecting Activity Monitor, or by selecting the toolbar icon for it.


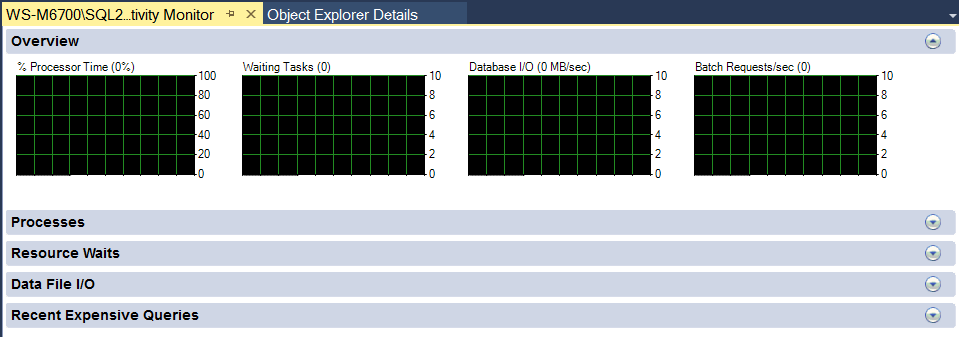
Either of these options will bring up the Activity Monitor in a new tab.

In this tab, you can get a quick overview of what is happening on this instance, in 4 specific areas. The “Processes” section shows you information about the current connections to the server. “Resource Waits” shows you what SQL Server is waiting on, grouped into categories. “Data File I/O” shows the activity in the database files, and “Recent Expensive Queries” shows the expensive queries in the plan cache. All of this information is readily available for you to drill into and investigate further.
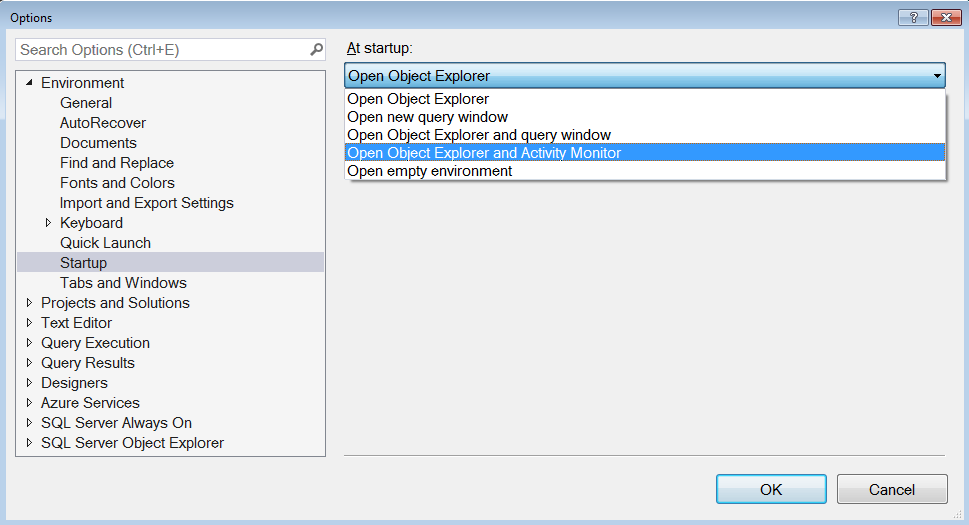
In Options | Environment | Startup, you can configure Activity Monitor to automatically start when you run SSMS.
The Activity Monitor can be useful for seeing a mile-high view of a SQL Server instance. However, leaving it running can be as big a drag on the instance as is the use of SQL Profiler. The Resource Waits section of Activity Monitor, which would have been one of the strongest features, has been dumbed down by the filtering of wait types, and that many others are grouped together into categories. Sure, using the Activity Monitor convenient – but spend the time to develop your own scripts or XE sessions to get this information in a more efficient, with less impact. Overall, refrain from using it… and especially don’t set up SSMS to open it automatically on startup.
This post is for day thirty-one of my month-long blog series “A Month of SSMS Tips”. I have a landing page for the series at bit.ly/MonthOfSSMS. Please visit this page for an easy place to quickly view all of the other tips in this series.
The post SSMS Activity Monitor (Day 31) appeared first on Wayne Sheffield.


