Looking for recompiling stored procedures
-
April 11, 2023 at 6:56 pm
I have been tasked with the job of finding the top X number of stored procedures that are being recompiled regularly on a group of servers. I've tried several times to Google this and keep coming across "How To" articles on setting stored procedures for recompile, which is not what I want. I'm trying to get a a current list of procs that are recompiling often so we can look into what is going on with them.
Does anyone have a link to an article that could help me out? Or thoughts on what I can search for that might give me different results?
Your input is greatly appreciated.
-
April 11, 2023 at 8:39 pm
-
April 11, 2023 at 11:09 pm
I have not. But don't they have to be set up in advance?
I found something about SQL Profiler / server trace and perfmon as well, but again, stuff that needs set up. I can't seem to find anything that collects the information without being set up and can be queried aside from general numbers.
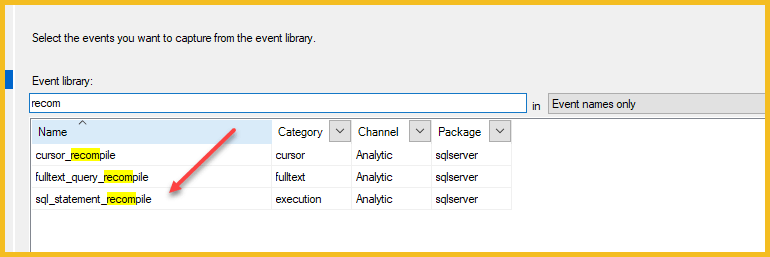
I'll try the events. It's probably a lot easier on the server than my other two options. My problem is I have to do this for several servers. Dozens at least.
-
April 12, 2023 at 12:34 am
If you have Query Store turned on maybe this is what you are looking for?
SELECT distinct top 10
    qt.query_sql_text
    , q.query_id, OBJECT_NAME(q.object_id), q.count_compiles as count_compiles
    , qt.query_text_id
    , p.plan_id
--, rs.last_execution_time
FROM sys.query_store_query_text AS qt
JOIN sys.query_store_query AS q             ON qt.query_text_id = q.query_text_id
JOIN sys.query_store_plan AS p              ON q.query_id = p.query_id
JOIN sys.query_store_runtime_stats AS rs    ON p.plan_id = rs.plan_id
ORDER BY count_compiles DESC;
----------------------------------------------------
-
April 12, 2023 at 4:23 am
@Brandie...
The code at the following link, written by Jonathan Kehayias, has been a huge help on occasion.
As one example, one of the screens in an app that our folks wrote was taking a huge amount of time to render. The stored procedure ran in only 100 ms. I used the code on the related database... it takes a while to run so be patient... What it showed was the same query... it was usually recompiling every time it ran and the compile time varied from 2 seconds to a whopping 22 seconds.
The code takes no setup. Just load it into SSMS and run it in the datatabase in question. I DID modify the code to add the DB filter and a couple of other things but this is almost entirely Jonathan's good work.
p.s. It IS dependent on what is actually in cache and so can change throughout the day.
DROP TABLE #MyHead
GO

    SET TRANSACTION ISOLATION LEVEL READ UNCOMMITTED  --2673
;
   WITH XMLNAMESPACES
        (DEFAULT 'http://schemas.microsoft.com/sqlserver/2004/07/showplan')
 SELECT TOP 30000
         tab.CompileTime_ms
        ,tab.CompileCPU_ms
        ,tab.CompileMemory_KB
        ,DBName = DB_NAME(tab.dbid)
        ,tab.dbid
        ,StatementText  = --(
                           --SELECT LongString
                           --  FROM util.ShowLongString
                                  (
                                    SUBSTRING(
                                               st.text
                                              ,(qs.statement_start_offset / 2) + 1
                                              ,(CASE qs.statement_end_offset
                                                WHEN -1 THEN DATALENGTH(st.text)
                                                ELSE qs.statement_end_offset
                                                 END - qs.statement_start_offset) / 2 + 1
                                             )
                                  )
                          --)
        ,qs.creation_time
        ,qs.last_execution_time
        ,qs.execution_count
        ,Duration_ms    = qs.total_elapsed_time/1000
        ,CpuTime_ms     = qs.total_worker_time/1000
        ,AvgDuration_ms = (qs.total_elapsed_time/qs.execution_count)/1000
        ,AvgCpuTime_ms  = (qs.total_worker_time/qs.execution_count)/1000
        ,MaxDuration_ms = qs.max_elapsed_time/1000
        ,MaxCpuTime_ms  = qs.max_worker_time/1000
        ,qs.query_hash
        ,qs.query_plan_hash
   INTO #MyHead
   FROM (--==== This rips and strips the execution plans XML for the compile time info we want
         SELECT  QueryHash          = c.value('xs:hexBinary(substring((@QueryHash)[1],3))', 'varbinary(max)')
                ,QueryPlanHash      = c.value('xs:hexBinary(substring((@QueryPlanHash)[1],3))', 'varbinary(max)')
                ,CompileTime_ms     = c.value('(QueryPlan/@CompileTime)[1]', 'int')
                ,CompileCPU_ms      = c.value('(QueryPlan/@CompileCPU)[1]', 'int')
                ,CompileMemory_KB   = c.value('(QueryPlan/@CompileMemory)[1]', 'int')
                ,qp.query_plan
                ,qp.dbid
           FROM sys.dm_exec_cached_plans AS cp
          CROSS APPLY sys.dm_exec_query_plan(cp.plan_handle) AS qp
          CROSS APPLY qp.query_plan.nodes('ShowPlanXML/BatchSequence/Batch/Statements/StmtSimple') AS n(c)
        ) AS tab
   JOIN sys.dm_exec_query_stats AS qs ON tab.QueryHash = qs.query_hash
  CROSS APPLY sys.dm_exec_sql_text(qs.sql_handle) AS st
  WHERE tab.dbid IN (--===== Return entries from only the databases we're interested in.
                    DB_ID() --You can change this to a CSV list of DB_IDs.
                    )
  ORDER BY tab.CompileTime_ms DESC
 OPTION (RECOMPILE, MAXDOP 1)
;
 SELECT * FROM #MyHead
  ORDER BY CompileTime_ms DESC,StatementText
;
--Jeff Moden
RBAR is pronounced "ree-bar" and is a "Modenism" for Row-By-Agonizing-Row.
First step towards the paradigm shift of writing Set Based code:
________Stop thinking about what you want to do to a ROW... think, instead, of what you want to do to a COLUMN.Change is inevitable... Change for the better is not.
Helpful Links:
How to post code problems
How to Post Performance Problems
Create a Tally Function (fnTally)
Viewing 5 posts - 1 through 5 (of 5 total)
You must be logged in to reply to this topic. Login to reply
