This article explains the different methods to find the startup time of an SQL Server. We can use any of the following specified methods to find the instance startup time:
- Create the date of TempDB.
- The log from Windows event viewer and SQL Server Error log.
- SQL Server native monitoring dashboard.
Before we go further, let us restart SQL Server services. We can restart the SQL Services using SQL Server Management Studio, SQL Server configuration manager, PowerShell script, or Services MMC (Microsoft management console).
Note: I restarted the SQL Services at 13:41 IST.
Find SQL Server startup time using TempDB
As we know, when we restart the SQL Server, a TempDB is automatically created. So, the TempDB create date can be considered as the SQL Server instance start time. The create date of TempDB can be retrieved by running the following query:
USE master
go
SELECT name AS [Database Name],create_date [Instance Start Time]
FROM sys.databases WHERE name='TempDB'
Output

As you can see, the TempDB creation date is ‘2023-04-05 13:41:14.927’, indicating the SQL instance was started at 13:41 PM IST.
Find SQL Server start time using SQL Server Error Log
We can find the instance startup time from the SQL Server Error log. Note that you cannot find a specific message like ‘SQL Server Instance is starting’ in the error log. Instead, you can see the DateTime of the event ‘SQL Server is now ready for new client connection.’ Message. The same datetime can be considered as the start time of the SQL Server instance.
Launch SSMS and connect to SQL Server Instance --> Expand SQL Server Instance --> Expand SQL Server Agent --> Expand Error logs --> Select Current.
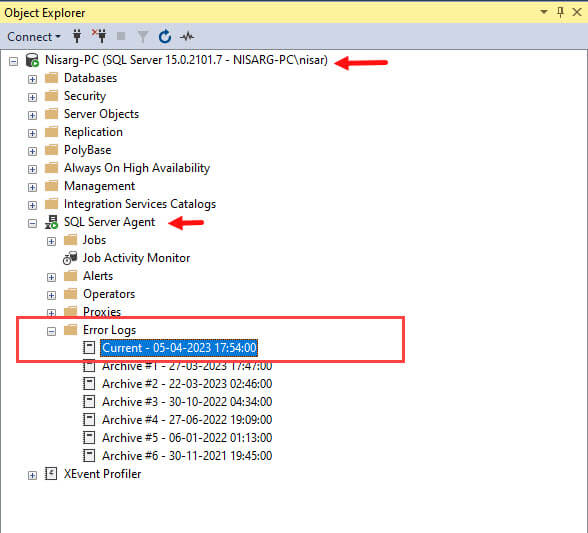
In the Select Logs section of the Log file viewer, Expand SQL Server and Select Current. The events will be loaded in the dialog box.
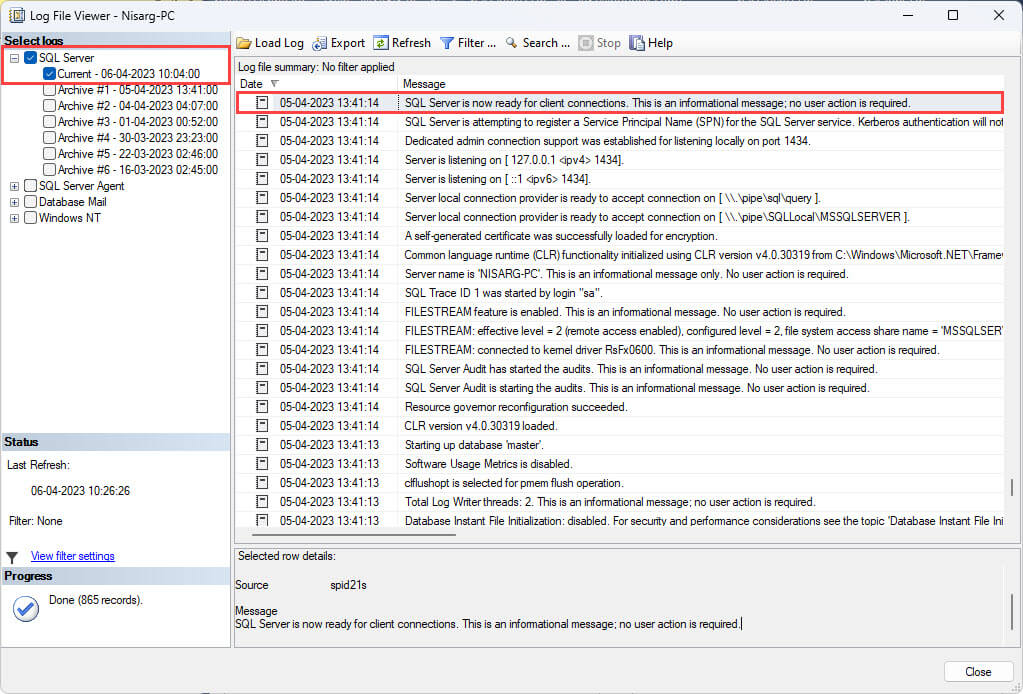
Scroll down to the bottom of the logs. Here you can see the text ‘SQL Server is now ready for client connections.’ The datetime of this event is ‘2023-04-05 13:41:14.927’, so our instance start time is ‘2023-04-05 13:41:14.927’.
Alternatively, we can use the xp_readerrorlog procedure to filter the error log. In our case, we will use the xp_readerrorlog stored procedure can be written as follows:
use master
go
EXEC xp_ReadErrorLog 0, 1, N'SQL',N'SQL Server is now'
Query Output

Find SQL Server Startup time using Event Viewer
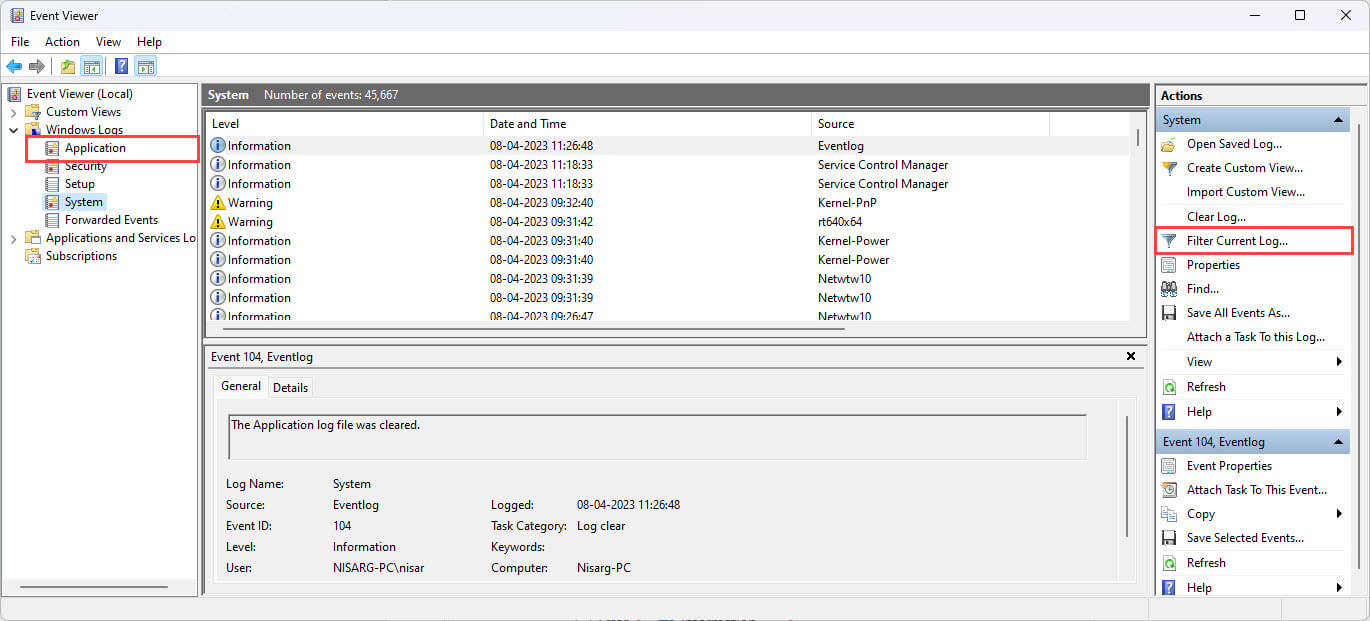
You can view the instance startup time from the Windows event viewer. The event id for the SQL Server instance is 17162. We can view the details by filtering the Application events. Open Control Panel --> Administrative tools --> Event viewer. If you are using Windows 11, the event viewer is in Control Panel --> Windows Tools --> Event Viewer. In the Event Viewer dialog box, select Application from Left-pan and select Filter log option as shown in the following image:
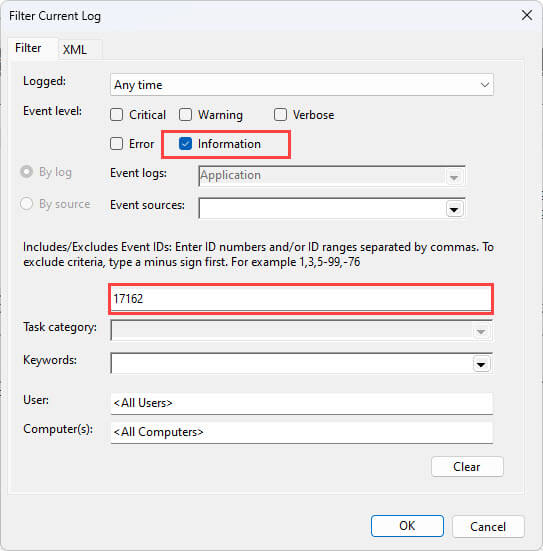
A dialog box opens. Select Information as event level, enter 17162 in the Event ID text box, and hit Ok.
All events will be filtered, which looks like the below image:
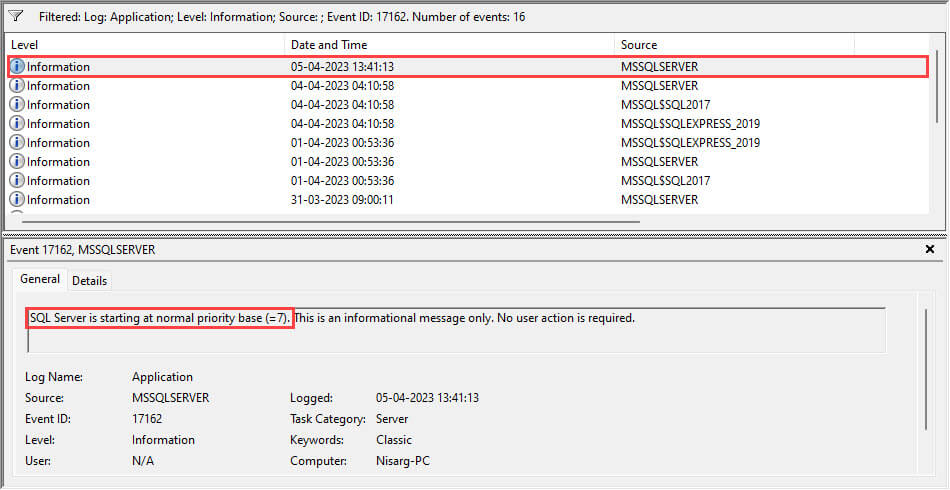
As you can see in the above screenshot, there is an event message that SQL Server is starting at a normal priority base, logged on at 2023-04-05 13:41:13’ time, which means that the SQL Server started at 13:41.
Suppose you have installed SQL Server on Linux operating system. In that case, you can find the SQL Server startup time details from the syslog file in /var/log directory. You can use the grep command to filter the log. The grep command to filter the log is below:
root@SQLLinux:~# grep "SQL Server" /var/log/syslog
Command Output

I haven’t restarted the SQL Services on a Linux machine, so the datetime is different. Note: The user requires sysadmin permission on OS to read the error log (syslog file).
Find instance start time using SQL Server native dashboard
The SQL Server has its own native database monitoring and server dashboard, which provides detailed information about the database server and the SQL databases created/hosted on it. You can access the dashboard using SQL Server management studio. To do that, right-click on SQL Server connection --> Hover Reports --> Standard Reports --> Server Dashboard.
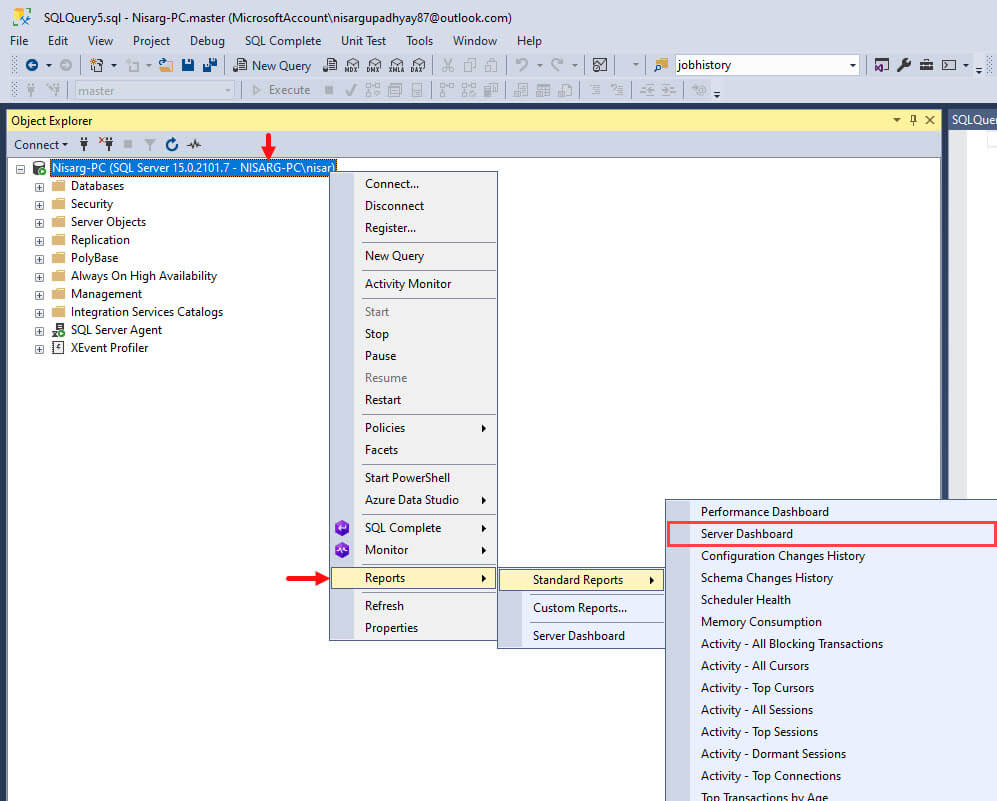
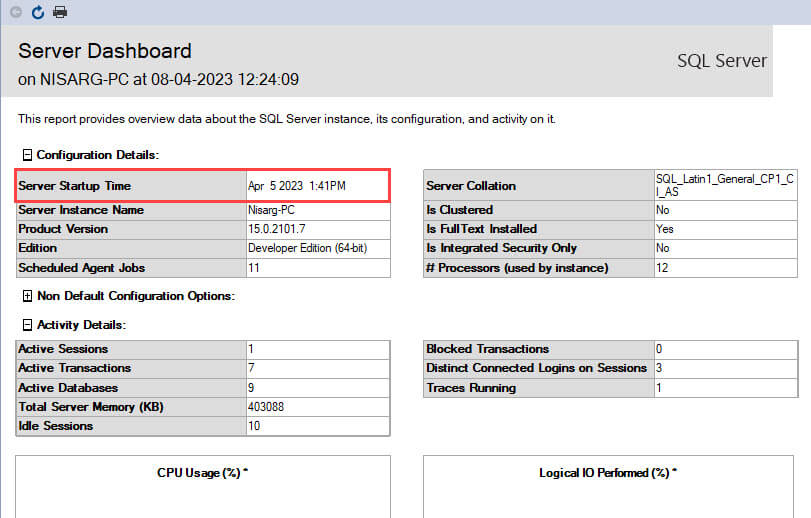
The Server dashboard opens. In Server Dashboard, you can see the Server Startup time, which is 2023-04-05 13:41.
You can also use Monitor from dbForge SQL Tools, which is free and can be used to view the startup time and other important details of the SQL Server instance.
Dynamic Management view
You can view the SQL Server startup time by querying the sys.dm_os_sys_info dynamic management view. The DMV provides the details of the operating system and other helpful information about the resources of the server on which the SQL Server is installed. You can read more about it in this article. The DMV has a column named sqlserver_start_time which shows the SQL Server instance startup time. The query is the following:
use master
go
SELECT cpu_count
                       ,cpu_count
                       ,hyperthread_ratio
                       ,physical_memory_kb
                       ,virtual_memory_kb
                       ,sqlserver_start_time
                       ,softnuma_configuration_desc
                       ,sql_memory_model_desc
                       ,socket_count
                       ,cores_per_socket
                       ,numa_node_count
                       ,container_type_desc FROM Sys.dm_os_sys_info
Query Output
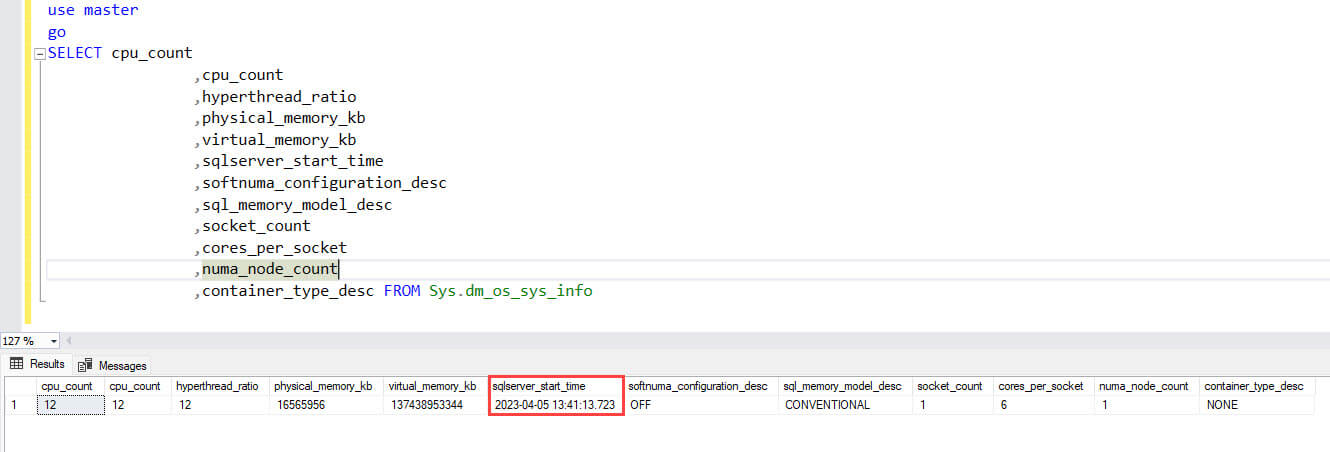
As you can see, the instance/SQL Server startup time is 2023-04-05 13:41:13.723.
Summary
In this article, we explored different methods to get the SQL Server startup time.

