This is part of a series of new job blog posts. You can find them all here.
The main goal for week 4: set up auditing for all Azure SQL Databases. This week is again about learning more Terraform. I’m using Terraform because my company requires this for infrastructure management. I’m setting up a home lab because I don’t want to practice my entry-level Terraform skills on work resources.
Table of Contents
Can you set up an Azure SQL database and auditing without all this automation? Yes, you can. This post isn’t about that. I have a tutorial showing you how to manually set up auditing. Here’s the shorter version and the longer version. This also isn’t a detailed tutorial on how you can use all these tools.
Here are some helpful resources for learning more about Terraform:
- If you have LinkedIn Learning, this is a very helpful course by Alexandra Illarionov.
- If you want to go the free route, you can get help directly from Terraform’s tutorials.
TL;DR If you want the code without much explanation, visit my GitHub code repository.
Visit Week 3 to Review the Prerequisites
Set Up Auditing
Now that you have your Azure SQL Server in place (if you followed the week 3 blog post), you can add auditing to it. First, you will need a Log Analytics Workspace to store audit data in it. I chose Log Analytics, but you can also choose Storage or Event Hub. I love Log Analytics because it’s easy to query data with Kusto. Plus, you can centralize all your database audit data in one workspace per subscription.
resource "azurerm_log_analytics_workspace" "example" {
  name                = "law-${azurerm_resource_group.rg.name}"
  location            = var.resource_group_location
  resource_group_name = random_pet.rg_name.id
  sku                 = "PerGB2018"
  retention_in_days   = 30
}
Now you can set up auditing. This means it will audit all Azure SQL databases on the server in the same way. It will put that audit data in the Log Analytics Workspace.
resource "azurerm_monitor_diagnostic_setting" "example" {
  name                       = "ds-${azurerm_resource_group.rg.name}"
  target_resource_id         = "${azurerm_mssql_server.example.id}/databases/master"
  log_analytics_workspace_id = azurerm_log_analytics_workspace.example.id

  enabled_log {
    category = "SQLSecurityAuditEvents"
    # enabled  = true

    retention_policy {
      enabled = false
    }
  }

  metric {
    category = "AllMetrics"

    retention_policy {
      enabled = false
    }
  }

  lifecycle {
    ignore_changes = [log, metric]
  }
}

resource "azurerm_mssql_database_extended_auditing_policy" "example" {
  database_id            = "${azurerm_mssql_server.example.id}/databases/master"
  log_monitoring_enabled = true
}

resource "azurerm_mssql_server_extended_auditing_policy" "example" {
  server_id              = azurerm_mssql_server.example.id
  log_monitoring_enabled = true
}
Once I’m done creating all these Terraform resources in files, I run terraform apply in the terminal. Then, once I’m happy with the tf files and they’ve all applied correctly, I will use either VS Code or GitHub Desktop to commit and push them to GitHub.
Configure Auditing
There is something important to know about Azure SQL auditing. It collects everything happening in the database by default with these audit action groups:
BATCH_COMPLETED_GROUP
SUCCESSFUL_DATABASE_AUTHENTICATION_GROUP
FAILED_DATABASE_AUTHENTICATION_GROUP
For now, I’m leaving my audit action groups as default because I want to see all the queries hitting the databases. This way I can analyze them for performance tweaks that may be required. To make these changes, you will need PowerShell. I usually run this in the Azure CLI but am working out how to set this up in Terraform.
You can get your current audit action groups by executing this code:
Get-AzSqlServerAudit -ResourceGroupName 'rg-hopeful-monkey' -Servername 'sql-rg-hopeful-monkey'
You can set your audit action groups to only collect schema and security changes with this code:
Set-AzSqlServerAudit -ResourceGroupName 'rg-hopeful-monkey' -ServerName ‘sql-rg-hopeful-monkey' `
-AuditActionGroup APPLICATION_ROLE_CHANGE_PASSWORD_GROUP, DATABASE_CHANGE_GROUP, `
DATABASE_OBJECT_CHANGE_GROUP, DATABASE_OBJECT_OWNERSHIP_CHANGE_GROUP, `
DATABASE_OBJECT_PERMISSION_CHANGE_GROUP, `
DATABASE_OWNERSHIP_CHANGE_GROUP, `
DATABASE_PERMISSION_CHANGE_GROUP, DATABASE_PRINCIPAL_CHANGE_GROUP, `
DATABASE_PRINCIPAL_IMPERSONATION_GROUP, `
DATABASE_ROLE_MEMBER_CHANGE_GROUP, `
SCHEMA_OBJECT_CHANGE_GROUP, SCHEMA_OBJECT_OWNERSHIP_CHANGE_GROUP, `
SCHEMA_OBJECT_PERMISSION_CHANGE_GROUP, USER_CHANGE_PASSWORD_GROUP
For now, I’m leaving my audit action groups as the default because I want to see all the queries hitting the databases so I can analyze them for performance tweaks that may be required. It will also help determine unused objects. I will update this post as I figure out how to use Terraform to set these audit action groups.
Querying Audit Data
Here’s a helpful Kusto tutorial. Kusto is very powerful and easy to use. If you know SQL, you can use Kusto easily.
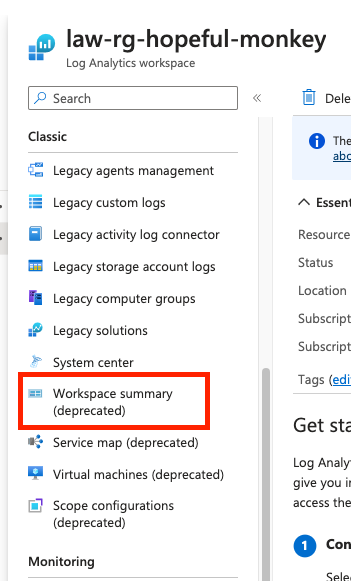
This Workspace Summary, which is being deprecated, is very helpful.

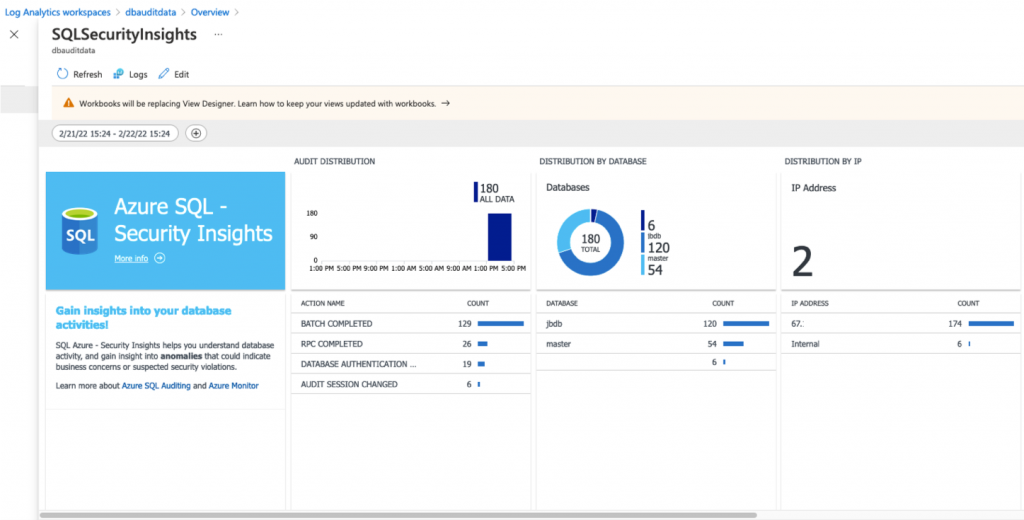
That workspace summary had this very nice dashboard.

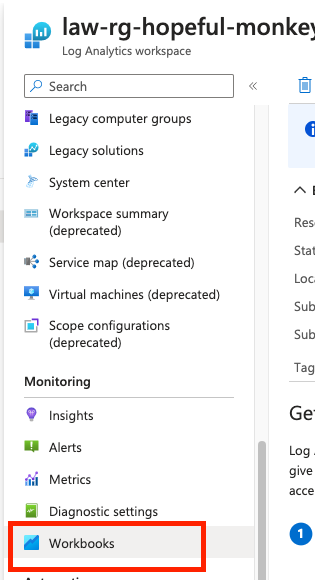
Apparently, that’s going away and you will need to use the new functionality called Workbooks. Here’s some more information about workbooks. I’m trying to figure out how to make a workbook that’s like the workspace summary that’s being deprecated.

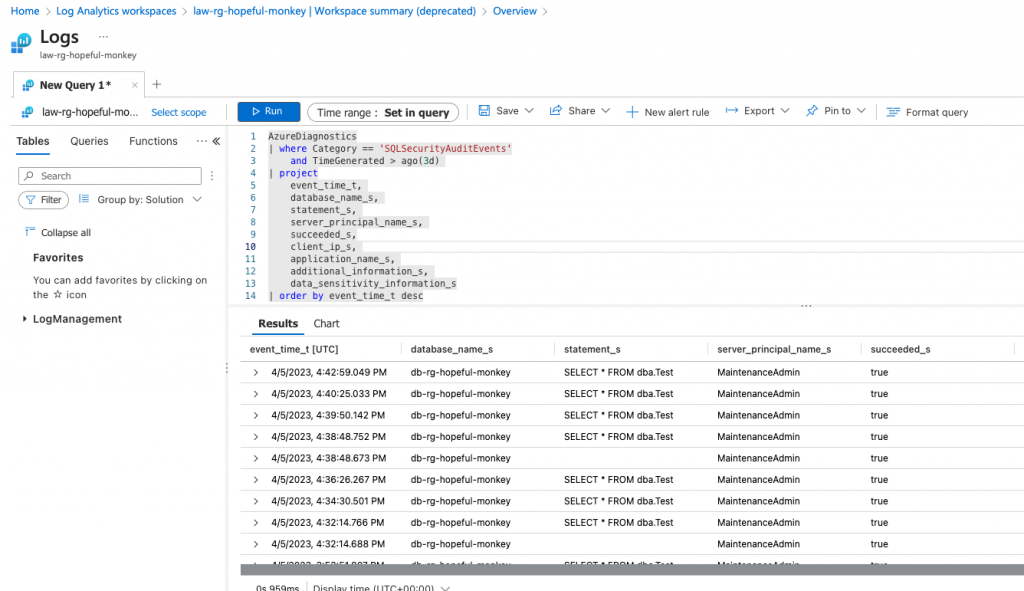
For now, I’m still using the Workspace Summary since it’s not yet removed. In the Workspace Summary, click on Logs, and you can run your own Kusto query. Let’s say you want to see your busiest databases. You can use this Kusto query in the Log Analytics Workspace to get that info:
AzureDiagnostics
| summarize QueryCountByDB = count() by database_name_s
Or maybe you want more details about what happened in the last day, and you can use this query:
AzureDiagnostics
| where Category == 'SQLSecurityAuditEvents'
   and TimeGenerated > ago(1d)
| project
    event_time_t,

    action_name_s,
    database_name_s,
    statement_s,
    server_principal_name_s,
    succeeded_s,
    client_ip_s,
    application_name_s,
    additional_information_s,
    data_sensitivity_information_s
| order by event_time_t desc
With that last query, you will see something like the following screenshot. It all depends on how you have your audit actions configured and what hits your databases.

Reporting on Audit Data
In the past, I used a Logic App, but that’s harder to set up with Terraform. I’m planning to create an Azure Function to do this instead. This presentation gives you the steps I used in my logic app starting on slide 30. I will add more info on the Terraform setup of an Azure Function in a future post.
The post New Job -> Week 4 -> Set Up Auditing appeared first on sqlkitty.

