One of the real-world I/O troubleshooting problems is – If you have your databases spread across multiple LUNs and you want to find out which database files are experiencing high latency issues and driving the most I/Os to storage subsystem using performance counter (Avg. Disk sec/Read & Avg. Disk sec/Write). The counter doesn’t help you to identify which database files are experiencing latency issues.
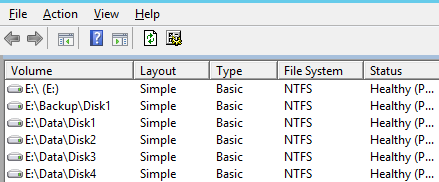
For example, if you follow the below image, you have a physical disk “E:” and your storage team has split the physical disk into multiple LUNs like “E:\Data\Data1”, “E:\Data\Data2”, “E:\Data\Data3”. You kept your databases’ files across all the LUNs, and suddenly one of the databases started experiencing high intensive I/O bound workload. It will drive the I/Os for all the LUNs, and you won’t be able to identify which database or database file is driving the I/O.

As I mentioned above, the performance counter won’t pinpoint the problem because it doesn’t provide the database file wise disk latency details. That’s where the sys.dm_io_virtual_file_stats comes in the picture. In this post, I will be discussing the DMF sys.dm_io_virtual_file_stats.
DMF: sys.dm_io_virtual_file_stats
The DMF is going to return you I/O statistics for data and log files, such as the total number of I/Os performed on a file. As input parameters, this function takes a database_id and a file_id. If you want to return IO statistic information for all files, you can pass in NULL values for both of these.
Note: The DMF contains cumulative I/O information for each database file. The DMF data get reset on the instance restart, database offline, detached and reattached activities.
SELECT
DB_NAME(fs.database_id) AS [database name],
CAST(fs.io_stall_read_ms/(1.0 + fs.num_of_reads) AS NUMERIC(10,1)) AS [avg_read_stall_ms],
CAST(fs.io_stall_write_ms/(1.0 + fs.num_of_writes) AS NUMERIC(10,1)) AS [avg_write_stall_ms],
CAST((fs.io_stall_read_ms + fs.io_stall_write_ms)
/(1.0 + fs.num_of_reads + fs.num_of_writes)
AS NUMERIC(10,1)) AS [avg_io_stall_ms],
CONVERT(DECIMAL(18,2), mf.size/128.0) AS [File Size (MB)],
mf.physical_name,
mf.type_desc,
fs.io_stall_read_ms,
fs.num_of_reads,
fs.io_stall_write_ms,
fs.num_of_writes,
fs.io_stall_read_ms + fs.io_stall_write_ms AS [io_stalls],
fs.num_of_reads + fs.num_of_writes AS [total_io]
FROM sys.dm_io_virtual_file_stats(null,null) AS fs
INNER JOIN sys.master_files AS mf WITH (NOLOCK) ON fs.database_id = mf.database_id
AND fs.[file_id] = mf.[file_id]
ORDER BY avg_io_stall_ms DESC OPTION (RECOMPILE);
The output of the above query:
Click on the picture to zoom it
I/O Latency Threshold Value:
You might be wondering what would be I/O latency threshold for the DMF. It will be the same threshold value what we have for the performance counter. To know the threshold value, you can follow the below threshold values or Paul’s blog;
- < 1ms – – – – – – – ->Excellent
- < 5ms – – – – – – – ->Very good
- 5 – 10ms – – – – – – >Good
- 10 – 20ms – – – – – ->Poor
- 20 – 100ms – – – – ->Bad
- 100 – 500ms – – – ->Shockingly bad
- > 500ms – – – – – – >God Bless the storage system
The DMF shows values since the database came online. Therefore, the spikes of poor performance will be masked by the overall aggregation. It is recommended to capture the I/O statistics from the DMF over a period of time and do a through comparison before reach at conclusion.
Next Step:
Once you find that the database file(s) are experiencing high latency, you need to figure out the possible reasons of the high I/O to the database. You may give a start from the below points to find the cause;
- Check with your storage team whether particular LUNs are overloaded.
- Figure out Top I/O bound queries and check their query plan to identify the problematic areas like – table scans, sorting, implicit conversions,…etc.
- Enabling CDC (Change Data Capture) feature contributing extra I/O overhead to the database files.
- Too little memory is allocated to the SQL Server instance, and the same data is read from disk over and over because it cannot stay in memory and increase lazy writer and read activity.
- Enabling snapshot isolation that causes tempdb I/Os, plus potentially page splits.
Happy Learning!
References:
https://github.com/logary/logary/blob/master/src/services/Logary.Services.SQLServerHealth/StallInfo.sql
The post SQL Server Database Files Wise I/O Latency Details PART#1 appeared first on .


