I was given a task to optimize a black-box application. I wasn’t able to see its code, but the database was open for analysis. I caught the queries from the cache and then used them for some tests. The application was slow, and I first decided to look at the wait types to see where it hurts most.
I run the following query to catch the waits and got the following:
| WaitType | Percentage |
| CXPACKET | 85.17 |
| PAGEIOLATCH_SH | 8.97 |
| ASYNC_NETWORK_IO | 1.65 |
CXPACKET is the most consumable wait type. It occurs when trying to synchronize the query processor exchange iterator. You may consider lowering the degree of parallelism if contention on this wait type becomes a problem – http://msdn.microsoft.com/en-us/library/ms179984.aspx.
PAGEIOLATCH_SH is due to waiting on latch for a buffer that is under IO request. It could be buffer-pool memory pressure. Poor programming or the high number of recompilation of the query plans can be causing the occurrence of this wait type. The percentage part of this wait type is small and not comparable to the CXPACKET wait type.
ASYNC_NETWORK_IO is connected to the network. When users wait for big amounts of data. This could be related to the poor programming too. Today’s networks are usually high-speed and they do not seem to be a bottleneck. The percentage of this wait type is so small to start analyzing it.
The rest of the wait types were negligible percentages and I didn’t put them in the list. Next table shows the situation for some wait types on another server.
As you can see the CXPACKET wait type is not that high. However, it is usually almost the most dominant wait type of the servers I’ve been checking the wait types’ percentages.
What is CXPACKET mostly caused by?
Queries with many joined tables press the query optimizer to generate parallel plans and sub-plans so that parallel skew is the reason for the wait type.
When the files of the databases (including the tempdb) are on disks with different speeds. If for example the tempdb resides on slower disks and a parallel plan is to be executed, the operations that are done in the tempdb will be slower and the threads that have finished their work will have to wait for the slower ones. This type is called CXPACKET. A recommendation for the tempdb database files is that they reside on fast disks.
I/O and memory pressures also cause the occurrence of CXPACKET.
Recommendations to decrease the occurrence of CXPACKET:
The first recommendation is to change the max degree of parallelism (MAXDOP) option in the sys.sp_configure on server level. MAXDOP =1 means existence of serial plans only.
Another configurable option for this wait type is the Cost Threshold for Parallelism (CTP). It also is configured with sys.sp_configure. This option has no meaning when MAXDOP=1. For that reason it’s not good to set up MAXDOP=1 unless you have very strong reasons for it.
The Microsoft’s recommendation for MAXDOP are given in this reference – https://support.microsoft.com/en-gb/kb/2806535.
For the Cost Threshold for Parallelism I use the value of 50. There is no proof that it’s the best value, but the practice seems to say something like. I’ve put the option as best practice to be reconfigured on a database instance in this post. I didn’t change the default value of MAXDOP = 0.
Results
I made the test with about 980 queries. I divided the queries by their cost threshold value into three groups: Queries with CTP > 10,000, Queries with CTP between 1,000 and 10,000 and Queries with CTP less than 1000. The next query extracts the queries from the cached plans. It’s important that the server had not been restarted for a long enough period.
SET TRANSACTION ISOLATION LEVEL READ UNCOMMITTED;
WITH XMLNAMESPACES(DEFAULT 'http://schemas.microsoft.com/sqlserver/2004/07/showplan')
SELECT
query_plan AS CompleteQueryPlan,
n.value('(@StatementText)[1]','VARCHAR(4000)') AS StatementText,
n.value('(@StatementOptmLevel)[1]','VARCHAR(25)') AS StatementOptimizationLevel,
n.value('(@StatementSubTreeCost)[1]','VARCHAR(128)') AS StatementSubTreeCost,
n.query('.') AS ParallelSubTreeXML,ecp.usecounts,ecp.size_in_bytes
FROM sys.dm_exec_cached_plans AS ecp
CROSS APPLY sys.dm_exec_query_plan(plan_handle) AS eqp
CROSS APPLY query_plan.nodes('/ShowPlanXML/BatchSequence/Batch/Statements/StmtSimple') AS qn(n)
WHERE n.query('.').exist('//RelOp[@PhysicalOp="Parallelism"]')=1
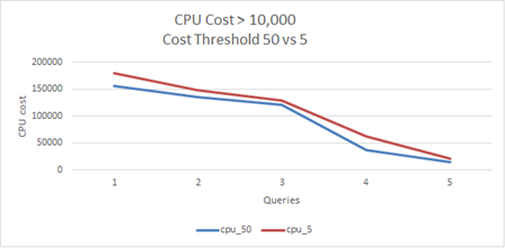
The following figure shows the decreasing of the CPU cost for the top 5 queries (Figure 1).

Figure 1, Queries with CTP > 10,000
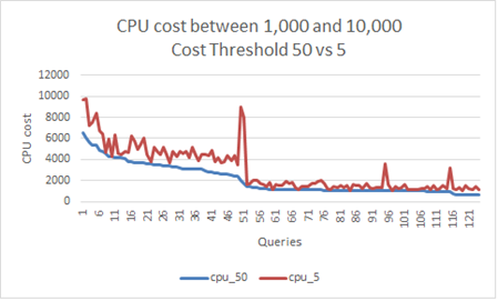
Next Figure 2 shows the improving results for the CPU cost for the queries with CPU cost between 1,000 and 10,000. About 130 queries were taken for this sub-test.

Figure 2. Queries with CTP between 1,000 and 10,000
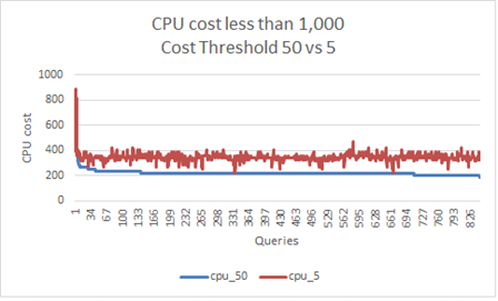
The biggest part of the queries had CPU cost less than 1000. They are about 850 queries out of the 980. Figure 3 shows decreasing of the CPU cost curve.

Re-check
Next table shows the situation for the wait types some days later.
| WaitType | Percentage |
| CXPACKET | 40.37 |
| TRANSACTION_MUTEX | 33.15 |
| THREADPOOL | 9.17 |
| LATCH_EX | 4.44 |
| SOS_SCHEDULER_YIELD | 3.46 |
The Results are very satisfying. The CXPACKET wait type is decreased significantly. Other wait types occurred in the list as they always sum-up to 100%, but their analysis is possibly not needed.


