I was recently doing some work on my Windows 10 desktop and placed a drive on one of the slower internal disks. It’s old. It’s 7200 RPM. It’s just plain slow. All that’s fine and good as I’m not doing any production workloads from this development machine.
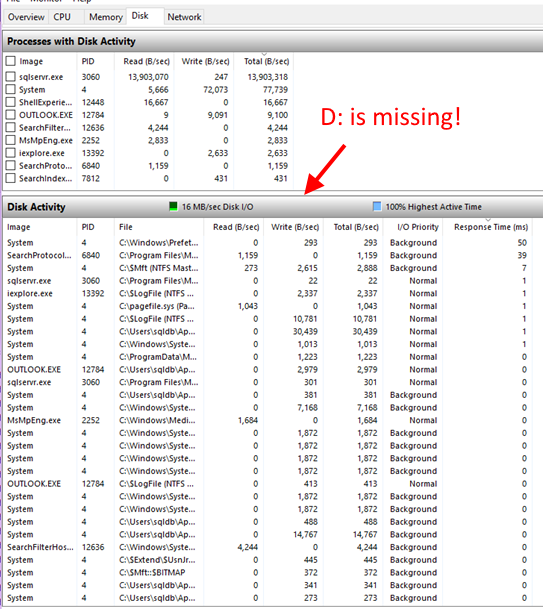
I thought that until one query was taking exceptionally long to complete. I pulled up Resource Monitor to check CPU and storage pressure. Everything looked just fine. In fact, the D: drive wasn’t even listed as having any IO latency.
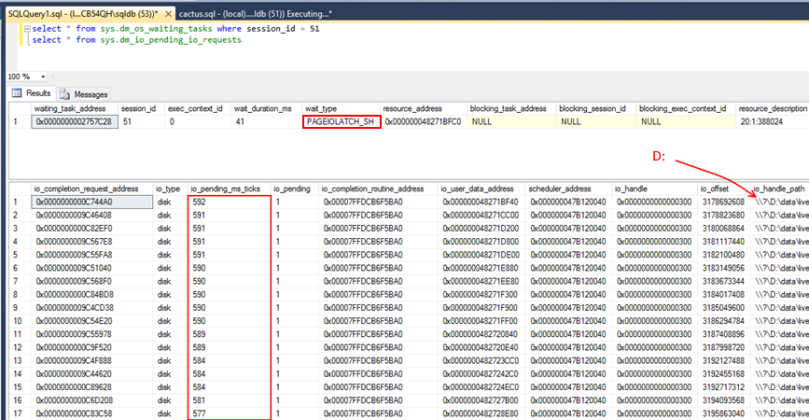
Next, I looked at sys.dm_exec_requests and sys.dm_os_waiting_tasks to see what my session was waiting on. To my surprise, I found that the wait_duration_ms was in the hundreds of milliseconds for PAGEIOLATCH waits. I looked at Resource Monitor again and then noticed that D: was not only showing no latency, it was not showing at all!
I checked sys.dm_io_pending_io_requests and found requests waiting for D: for more than 500ms!!


What’s Up?
From here I opened Performance Monitor, which did show the latency on D: yet still nothing from Resource Monitor. Restarting Resource Monitor didn’t resolve the issue.
After rebooting the D: drive magically appeared, giving no time to do further troubleshooting on the issue; however, the lesson has been learned. Resource Monitor is an excellent real-time troubleshooting tool, capable of providing a wealth of information but may under unknown rare circumstances neglect to give the information you’re looking for.
Troubleshooting Potential Storage Issues- With Or WITHOUT Resource Monitor
The following is a list, in no particular order, of metrics I would typically use to troubleshoot a potential storage issue.
- Start a Performance Monitor collection. It’s always good to have recorded metrics you can go back and look at. I recommend having a “Black Box” capture always running in the background on your servers to ensure you have something to look at if needed.
- Check Resource Monitor for latency. This can be helpful, since it provides file information.
- Review sys.dm_io_virtual_file_stats to obtain an average IO latency per file.
- Review sys.dm_os_wait_stats to gauge the overall history of waits on the instance.
- Review sys.dm_exec_requests or sys.dm_os_waiting_tasks to identify what the currently workload is waiting on.
- Follow up with sys.dm_io_pending_io_requests to research any waits for IO found in the current workload.
While I do use Windows Resource Monitor as a real-time troubleshooting tool on a regular basis, it’s important to realize that it’s not always a catch all for storage troubleshooting. Sticking to the basics is sometimes the best approach.
![]()


