The host for T-SQL Tuesday #79 is Michael J. Swart (b|t), and his topic of choice is to write about the new release of SQL Server 2016.
This past weekend I attended the SQL Server 2016 Launch Discovery Day in Raleigh, NC. I have attended several SQL Server launch events over the years, but this one was quite different. While it wasn’t a real launch event, it was marketed as a hands-on event to learn about the newest release of SQL Server. The hands-on part for everyone to breakup into teams of five to solve a pre-determined problem. Basically, this was hackathon for SQL Server, and something I’ve never done before.
We started early in the morning with a few presentations about SQL Server 2016. Kevin Feasel (b|t) spoke about the new features, and SQL Server MVP Rick Heiges (b|t) spoke about a real-world win using columnstore indexes in SQL Server 2016. Just before our lunch break the hack was revealed; the basics of which were simple.
First, you are given a set of data set; just five tables containing the following information.
- Virtual Chapter membership (with member location)
- SQL Saturday Registration Data and session/track
- PASS Membership Data
- Multi-year Summit Data including title, track, score etc
- Multi-year Summit Registration data including geographic location of attendee
Then you must design a solution to answer these questions.
- From how far away do attendees travel to SQL Saturday? Are there any geographic trends to the distances traveled?
- Does the SQL Saturday session data provide any insight into what sessions are chosen for Summit? Are there any trends in session or topic content that can be established?
- Are there are geographical insights that can discerned? Do the sessions presented at SQL Saturday help predict popularity or selection of sessions at Summit?
- Does virtual chapter member data provide any insights into PASS membership growth?
The judges score each solution based on the following criteria.
- Use of new features in SQL Server 2016
- Usefulness of the dashboard in Power BI/visualizations for the community
- Completeness of the solution
- Innovativeness of solution
- Bonus points for mobile friendliness
Your solution must be completed in 3 hours.
On paper this all sounds pretty easy, but in practice it was quite hard. I am no BI developer and the other members of my team did not have any expertise in that area either, but we still managed to create a solution and have fun doing so.
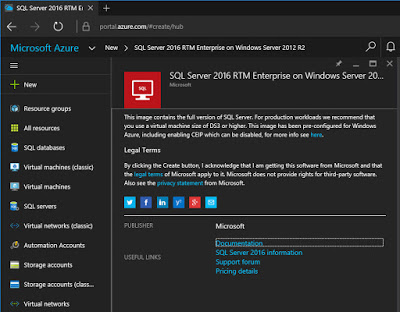
The first issue was had was how to combine our development work on the same database. This one was easy…just use Azure. In the span of about 30 minutes, I spun up a new Azure VM with SQL Server 2016 pre-installed, uploaded the database, setup logins, and opened the appropriate ports. I then gave my team members the URL and credentials so they each could connect from their laptops.
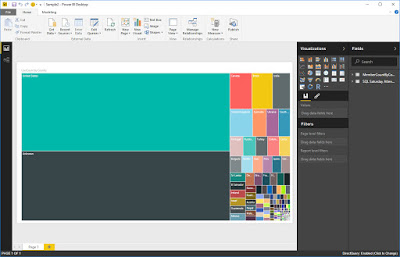
One of my team members, Dhruv, wanted to get SQL Server R Services installed to analyze the data set. Machine learning was his specialty, and since R Services is a new feature for SQL Server 2016, we thought this would be a good place to start. However, this proved to be mistake for our team. We spent way too much time trying to get it setup. This was mainly do to the the need to install the R components without an internet connection, or I should say a slow connection. I wish we could have implemented this, because Dhruv had some really good ideas. Even without R Services, he was able to create some nifty reports using Power BI.
One of my other team members, Mike, spent a lot of time trying to understand the data, and how to query it to produce the data for our reports. I’m not sure if this was by design, but let me just say the data set was horrible and every team complained about the time needed to clean it up to the point of being useful. Either way, it was just one of the many problems that we needed to overcome. Most of Mike's code was used in the Power BI dashboard that Dhruv created, but he was also able to write some code that made some good points about membership growth potential; however, we did not have time to build a report for it.
Our team (Team Tiger) finished our solution and presented to the group, but it was clear from the other presentations that we had been over matched. The winning solution was from Team Cheetah who had some unique insights into the data and designed their reports to reflect that detail. Not to mention, their presentation went into a lot of detail about what they had learned.
I really liked the entire event, but I wish that we had more time to work on the solution. Three hours seems like a lot, but after thinking about the challenge for a few days, there were so many more ideas that I came up with. For starters, one of the areas to score points was the use of new SQL Server 2016 features. That basically translates into ANY new feature whether it helps you produce a better looking report or not. With that in mind, I could have done the following.
- Enable the Query Store to capture performance metrics from our solution.
- Enabled Row-Level Security so we could the reports show different data based on which user is running it.
- Spin up additional VMs in different Azure datacenters so I could create a load-balanced Availability Group that would provide high availability and better response time for users closer to each datacenter.
- Setup Stretch Database for a single table to store older data in Azure.
While none of these things would have improved our presentation using Power BI, they are tasks that could have been easily implemented by me given my skillset. And by implementing them it would have definitely scored us a lot more points for the use of new SQL Server 2016 features. This is the big lesion that I learned from the event…always play to your strengths. Don’t try to learn a new skill in a few hours, just use the ones you already have. It will be a much better use of your time, and will most likely produce a better end result.
As I said, this was my first hackathon of any kind, but now I can’t wait to attend another one; especially one that deals with SQL Server.


