In continuation of our series in Data Science, we previously looked at A Data Science Approach in Product Analytics. One of the pressing tasks, especially at FinTech and e-commerce companies such as PayPal, Stripe, eBay, etc., is to recognize fraud before it occurs and stop it. In this article, we will see how companies do just that, using data.
E-commerce websites often transact huge amounts of money. Whenever a large sum of money is moved, there is a high risk of users performing fraudulent activities, e.g. using stolen credit cards or laundering money. Machine Learning excels at identifying fraudulent activities, and any website where you put your credit card information has a risk team in charge of avoiding frauds via machine learning.
The goal of this challenge is to build a machine learning model that predicts the probability that the first transaction of a new user is fraudulent.
The Problem
An e-commerce site sells hand-made clothes. We must build a model that predicts whether a user has a high probability of using the site to perform some illegal activity or not. This is a super common task for data scientists. We only have information about the user first transaction on the site and based on that we have to make our classification – ‘Fraud/No Fraud’
These are the tasks we need to do:
- For each user, determine their country based on the IP address
- Build a model to predict whether an activity is fraudulent or not.
- Explain how different assumptions about the cost of false positives vs false negatives would impact the model
Your boss is a bit worried about using a model she doesn’t understand for something as important as fraud detection. How would you explain to her how the model is making predictions? Not from a mathematical perspective (she couldn’t care less about that), but from a user perspective, what kind of users are more likely to be classified as at risk? What are their characteristics?
Let’s say we now have this model which can be used live to predict in real time if an activity is fraudulent or not. From a product perspective, how would you use it? What kind of different user experiences would you build based on the model output?
Data Available
We have 2 data sets that we can use here. The first data set has user characteristics and purchase history and contains this information:
- user_id : Id of the user. Unique by user
- signup_time : the time when the user created her account (GMT time)
- purchase_time : the time when the user bought the item (GMT time)
- purchase_value : the cost of the item purchased (USD)
- device_id : the device id. You can assume that it is unique by device. I.e., same device ID means that the same physical device was used for the transaction
- source : user marketing channel: ads, SEO, Direct (i.e. came to the site by directly typing the site address on the browser)
- browser : the browser used by the user
- sex : user sex: Male/Female
- age : user age
- ip_address : user numeric ip address
- class : this is what we are trying to predict: whether the activity was fraudulent (1) or not (0)
The second dataset can be used to get a user’s country based on their IP address. For each country, the dataset has a range. If the numeric IP address falls within that range, then the IP address belongs to the corresponding country.
- lower_bound_ip_address : the lower bound of the numeric ip address for that country
- upper_bound_ip_address : the upper bound of the numeric ip address for that country
- country : the corresponding country. If a user has an ip address whose value is within the upper and lower bound, then she is based in this country
Now let’s work on each of the tasks discussed above (using R):
Determining the Country
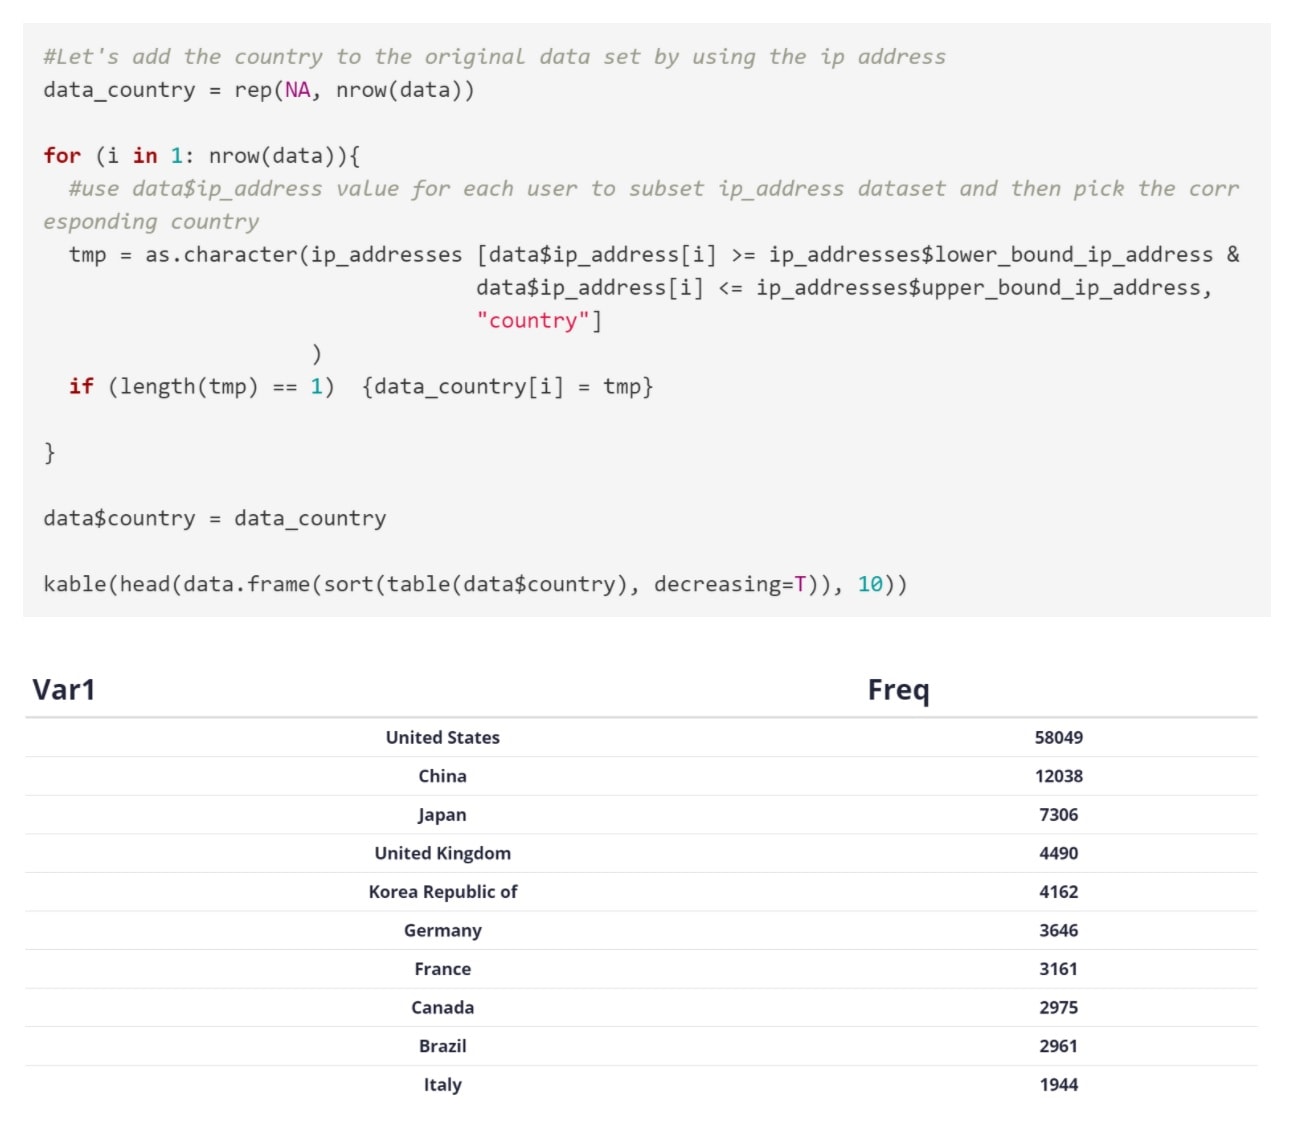
For each user, determine their country based on the IP address. We use the code below. This looks up the IP address and determines in which range it falls inside the second dataset:
Building a Model
Next we need to build a model to predict whether an activity is fraudulent or not. We also need to explain how different assumptions about the cost of false positives vs false negatives would impact the model.
Before jumping into building a model, think about whether you can create new powerful variables. This is called feature engineering and it is the most important step in machine learning. However, feature engineering is quite time consuming. For the sake of this example let’s consider a few obvious variables:
- The time difference between sign-up time and purchase time
- If the device id is unique or certain users are sharing the same device (many different user ids using the same device could be an indicator of fake accounts)
- Similarly, many different users having the same IP address could be an indicator of fake accounts
The code below is how we built and train the model with our data.
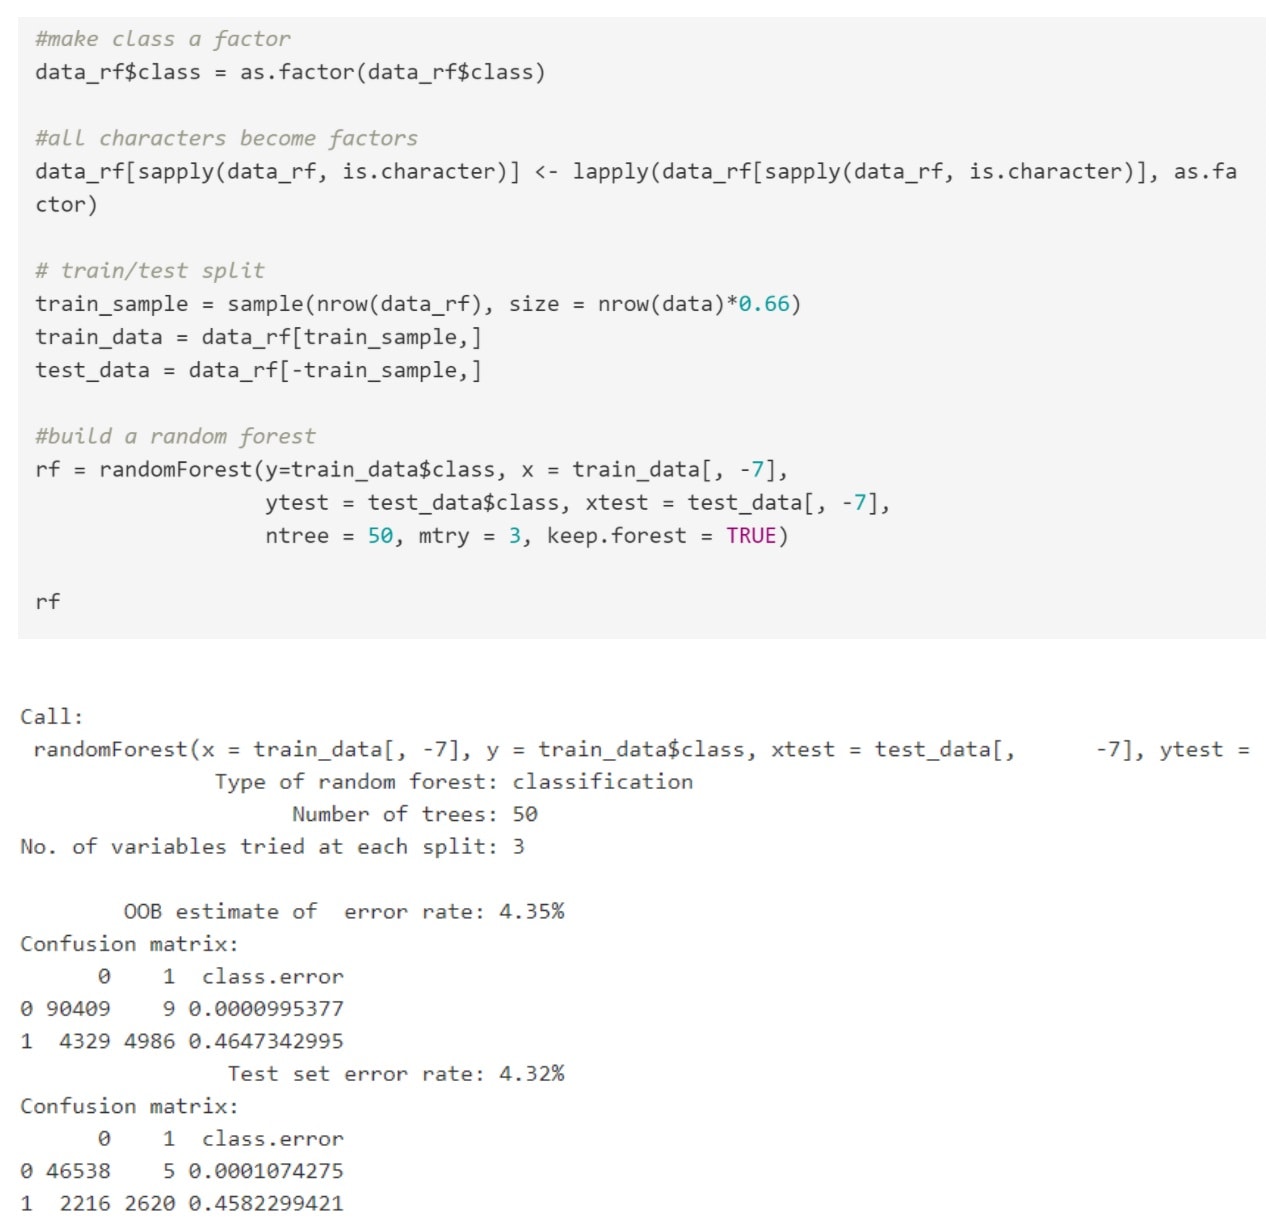
The confusion matrix looks good. We are not overfitting given that the OOB and test results are very similar. The class 0 error is almost zero, and we are doing surprisingly well also with regards to class 1 error, which is quite rare.
However, since the challenge asks about false positives and false negatives, this usually implies building the ROC and looking for possible cut-off points. And in general, especially when dealing with fraud, you should always do the cut-off analysis. There is no reason why the default 0.5 value has to be the best one, but this is the one I am starting with.
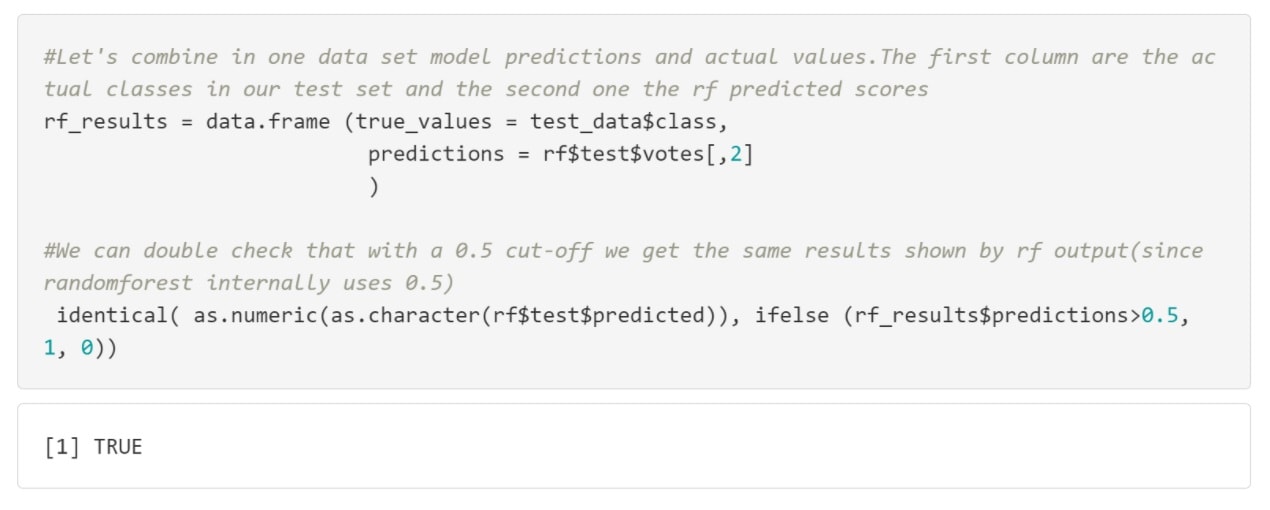
Looks like they are the same. However, is really 0.5 the best possible cut-off? It really depends on what we are optimizing for (accuracy? true positive? true negative? etc.).
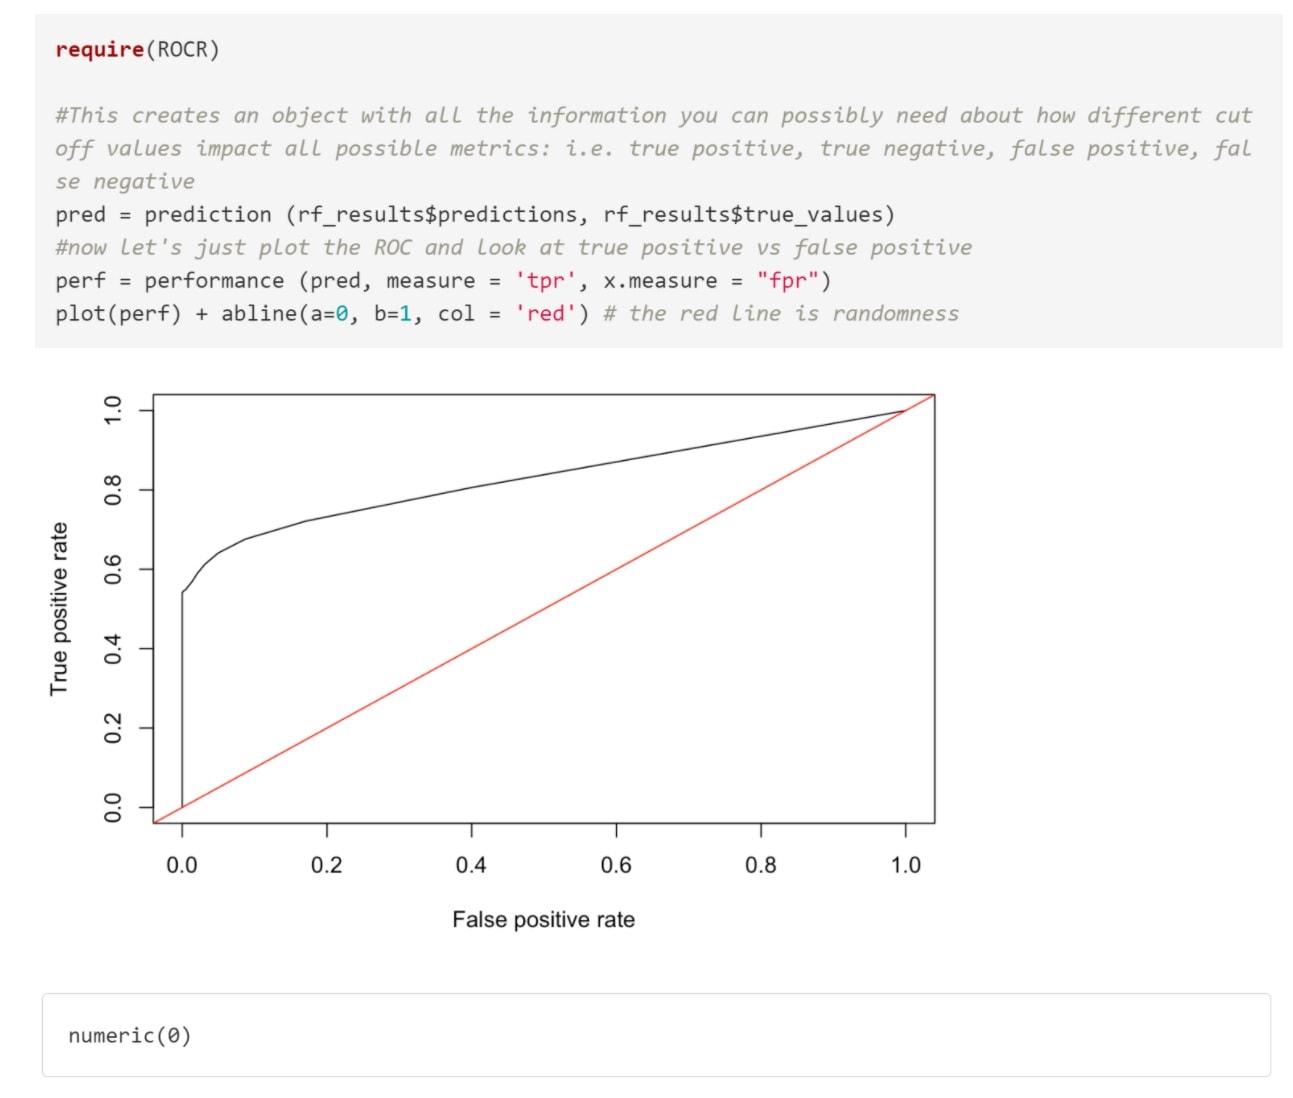
Based on the ROC, if we care about minimizing false positives, we would choose a cut-off that would give us a true positive rate of ~0.5 and false positive rate almost zero (this was similar to the random forest output). However, if we care about maximizing true positive rate, we will have to decrease the cut-off. This way we will classify more events as “1”: some will be true ones (so true positive goes up) and many, unfortunately, will be false ones (so false positive will also go up).
If we want to be a bit more accurate, we can use the approach of maximizing true positive rate - false positive rate, this is the same as maximizing (1-class1_error) -class0_error as we saw in the unbalanced data section.
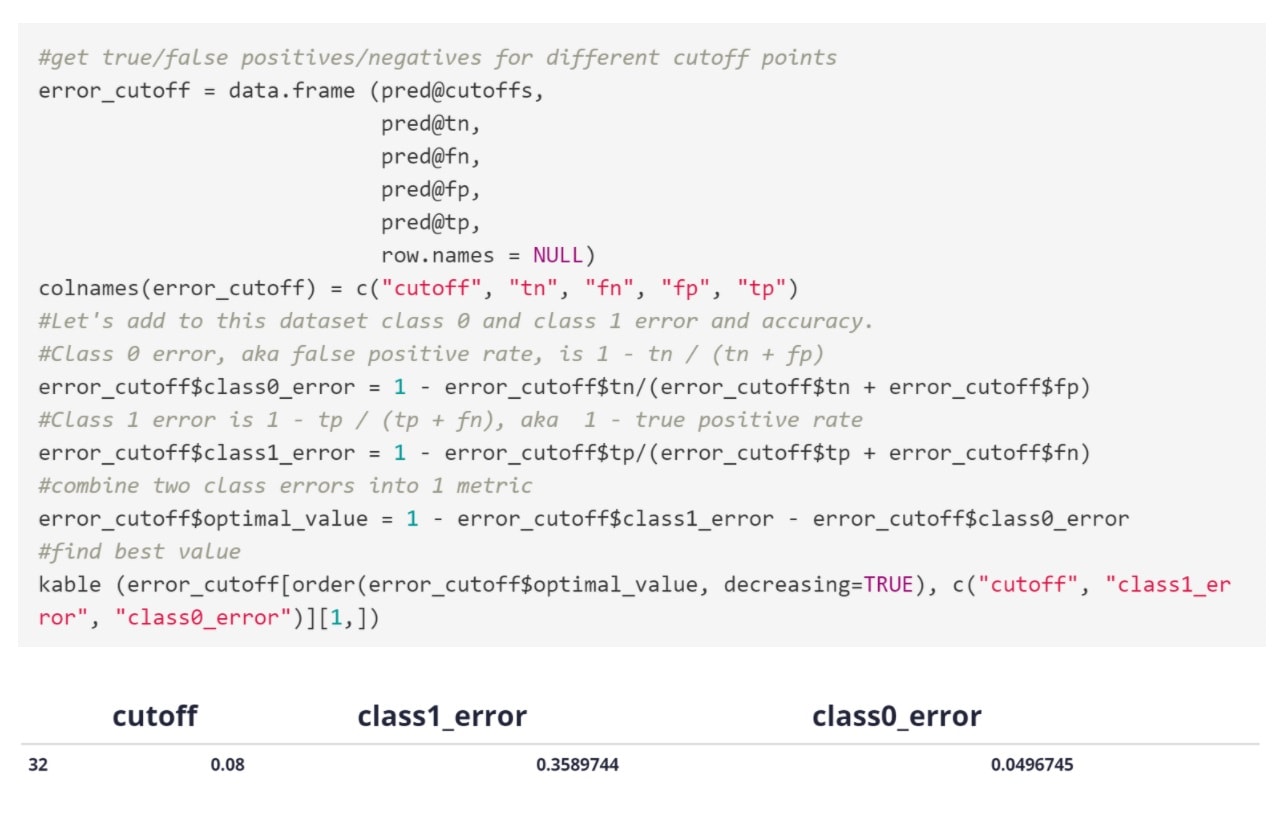
The best value is for ~65% true positive rate (specifically 1-0.35) and 5% false positive rate. You can find the corresponding point on the ROC curve.
At this point, we know the random forest is predicting well, so it simply boils down to building the partial dependence plots and explaining them.
The Final Question
The last question is very important. Let’s say you now have this model which can be used live to predict, in real time, if an activity is fraudulent or not. From a product perspective, how would you use it? That is, what kind of different user experiences would you build based on the model output?
We now have a model that assigns to each user a probability of committing a fraud. And, despite our model doing pretty well, no model is perfect. So you will have some misclassifications. It is crucial now to think about building a product that minimizes the impact (aka cost) of those misclassifications. A very commonly used approach is to think about creating different experiences based on the model score. For instance:
- If predicted fraud probability < X, the user has the normal experience (the high majority of users should fall here)
- If X <= predicted fraud probability < Z (so the user is at risk, but not too much), you can create an additional verification step, like phone number verifications via a code sent by SMS or asking to log in via social network accounts
- If predicted fraud probability >= Z (so here is really likely the user is trying to commit a fraud), you can tell the user his activity has been put on hold, send this user info to someone who reviews it manually, and finally either block the user or decide it is not a fraud so the session is resumed.
This is just an example and there are many different ways to build products around some fraud score. However, it is important because it highlights that a ML model is often really useful when it is combined with a product which is able to take advantage of its strengths and minimize its possible drawbacks (like false positives).
A data product doesn’t mean just putting a model into production, it means building a product based on a model output.


