One of the frequently quoted ETL best practices is to disable your non-clustered indexes during a data load. Basically the conventional wisdom is that you disable the non-clustered indexes, do your load, and then enable the non-clustered indexes, which functionally rebuilds them with the newly loaded data (a step you should be performing after a load of any size even if you *don't* disable your indexes - rebuild those newly fragmented indexes!)
So why doesn't anybody seem to do this?
 |
| https://memegenerator.net/img/instances/53039992/ponder-we-must.jpg |
--
IMPORTANT NOTE <cue scary music> - do NOT disable the clustered index when doing data loads or at any other time you want the table to be accessible. Disabling the clustered index makes the object (table or view) inaccessible.
If you disable the clustered index you are functionally disabling the object, and any attempts to access that object will result in an Error 8655:
Msg 8655, Level 16, State 1, Line 23
The query processor is unable to produce a plan because the index ‘PK_Person_BusinessEntityID’ on table or view ‘Person’ is disabled.
 |
| https://memegenerator.net/img/instances/62333367/no-please-dont-do-that.jpg |
--
I recently had a situation with a client where they have a load process that altogether runs over 24 hours - not one day-long query but rather a string of processes that usually takes 24+ hours to complete. The situation has worsened to the point where other things are impacted because the process is taking so long, and they asked me to check it out.
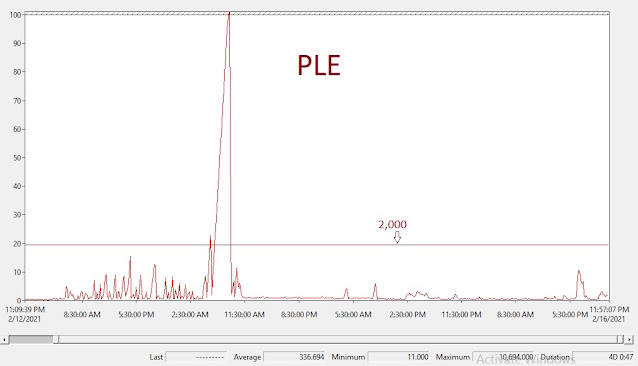
I started with all of the basics, and right away Page Life Expectancy during the relevant period jumped out:
The server has 128GB of RAM...so a PLE consistently below 1,000 is pretty low.
CREATE EVENT SESSION [Ntirety_MemoryGrantUsage] ON SERVERADD EVENT sqlserver.query_memory_grant_usage(ACTION(sqlserver.client_app_name,sqlserver.client_hostname,sqlserver.database_id,sqlserver.database_name,sqlserver.server_principal_name,sqlserver.session_id,sqlserver.sql_text)WHERE ([package0].[greater_than_uint64]([granted_memory_kb],(8192))))ADD TARGET package0.event_file(SET filename=N'Ntirety_MemoryGrantUsage',max_file_size=(256)),ADD TARGET package0.ring_buffer(SET max_events_limit=(0),max_memory=(1048576))WITH (MAX_MEMORY=4096 KB,EVENT_RETENTION_MODE=ALLOW_SINGLE_EVENT_LOSS,MAX_DISPATCH_LATENCY=5 SECONDS,MAX_EVENT_SIZE=0 KB,MEMORY_PARTITION_MODE=NONE,TRACK_CAUSALITY=OFF,STARTUP_STATE=ON)
USE masterGODECLARE @ErrorLogPath nvarchar(400), @XELPath nvarchar(500)SET @ErrorLogPath = (SELECT LEFT(cast(SERVERPROPERTY('ErrorLogFileName') as nvarchar(400)),LEN(cast(SERVERPROPERTY('ErrorLogFileName') as nvarchar(400)))-8))SET @XELPath = @ErrorLogPath+'Ntirety_MemoryGrantUsage*.xel'SELECT DISTINCT *FROM(SELECTDATEADD(hh, DATEDIFF(hh, GETUTCDATE(), CURRENT_TIMESTAMP), event_data.value(N'(event/@timestamp)[1]', N'datetime'))as Event_time, CAST(n.value('(data[@name="granted_memory_kb"]/value)[1]', 'bigint')/1024.0 as DECIMAL(30,2)) AS granted_memory_mb, CAST(n.value('(data[@name="used_memory_kb"]/value)[1]', 'bigint')/1024.0 as DECIMAL(30,2)) AS used_memory_mb, n.value('(data[@name="usage_percent"]/value)[1]', 'int') AS usage_percent, n.value ('(action[@name="database_name"]/value)[1]', 'nvarchar(50)') AS database_name, n.value ('(action[@name="client_app_name"]/value)[1]','nvarchar(50)') AS client_app_name, n.value ('(action[@name="client_hostname"]/value)[1]','nvarchar(50)') AS client_hostname, n.value ('(action[@name="server_principal_name"]/value)[1]','nvarchar(500)') AS [server_principal_name], n.value('(@name)[1]', 'varchar(50)') AS event_type, n.value ('(action[@name="sql_text"]/value)[1]', 'nvarchar(4000)') AS sql_textFROM(SELECT CAST(event_data AS XML) AS event_dataFROM sys.fn_xe_file_target_read_file(@XELPath, NULL, NULL, NULL))AS Event_Data_TableCROSS APPLY event_data.nodes('event') AS q(n)) MemoryGrantUsageORDER BY event_time desc
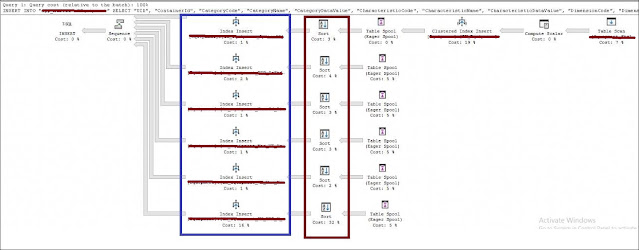
INSERT INTO "dbo"."Junk"SELECT "UID", "ContainerId", "CategoryCode", "CategoryName", "CategoryDataValue", "CharacteristicCode", "CharacteristicName", "CharacteristicDataValue", "DimensionCode", "DimensionName", "DimensionDataValue", "OptionId", "NumberOfItems", "IsStandard", "LanguageId", "Market", "VehicleType", "YearMonth", "BatchRefreshDate", "CreatedBy", "CreatedTimestamp", "ModifiedBy", "ModifiedTimestamp", "BatchId"FROM "dbo"."Junk_Stg"where "Market" = 'XYZ'
 |
| https://media.makeameme.org/created/so-simple-right.jpg |
 |
| https://memegenerator.net/img/instances/63334945/booyah.jpg |


