Continuation from the previous 79 parts, the whole series can be found at http://www.nikoport.com/columnstore/.
Given the number under-the-hood performance & manageability improvements that recent RC versions of SQL Server 2016 have had, I have decided to revisit them and update my previous blog posts. Especially I was interested in the predicate pushdown, which had some important limitations – like the lack of the GROUP BY support.
While revisiting the Columnstore Indexes – part 59 (“Aggregate Pushdown”), I have noticed some significant that were definitely worth blogging about.
For once more, I took the inevitable free database ContosoRetailDW and restored it with the following script:
USE master;

alter database ContosoRetailDW
    set SINGLE_USER WITH ROLLBACK IMMEDIATE;

RESTORE DATABASE [ContosoRetailDW]
    FROM  DISK = N'C:\Install\ContosoRetailDW.bak' WITH  FILE = 1,
        MOVE N'ContosoRetailDW2.0' TO N'C:\Data\ContosoRetailDW.mdf',
        MOVE N'ContosoRetailDW2.0_log' TO N'C:\Data\ContosoRetailDW.ldf',
        NOUNLOAD,  STATS = 5;

alter database ContosoRetailDW
    set MULTI_USER;
GO

Use ContosoRetailDW;
GO
ALTER DATABASE [ContosoRetailDW] SET COMPATIBILITY_LEVEL = 130
GO
ALTER DATABASE [ContosoRetailDW] MODIFY FILE ( NAME = N'ContosoRetailDW2.0', SIZE = 2000000KB , FILEGROWTH = 128000KB )
GO
ALTER DATABASE [ContosoRetailDW] MODIFY FILE ( NAME = N'ContosoRetailDW2.0_log', SIZE = 400000KB , FILEGROWTH = 256000KB )
GO

ALTER TABLE dbo.[FactOnlineSales] DROP CONSTRAINT [PK_FactOnlineSales_SalesKey];

create clustered columnstore Index PK_FactOnlineSales
on dbo.FactOnlineSales;
First of all, I have executed the simple scripts, testing the basic aggregation pushdown:
set statistics time, io on

select max(SalesQuantity)
    from dbo.FactOnlineSales;

select avg(SalesAmount)
from dbo.FactOnlineSales;

select max(SalesOrderNumber)
from dbo.FactOnlineSales;
Viewing their execution times and their execution plans I had nothing new to report: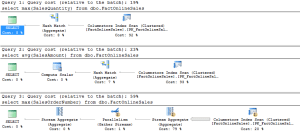
The 8 Bytes limit for supporting the predicate pushdown seems to be still there, the strings are still the difficult bit for the Columnstore Indexes operations, everything looks the same …
Its only when I executed the more complex aggregation query (which in the old CTP’s had significant delay, related to the inability to do local aggregation), I have started noticing something strange:
select sales.ProductKey,
sum(sales.SalesQuantity)
from dbo.FactOnlineSales sales
group by sales.ProductKey;
The execution plan for the query is still the same, but when I have clicked on the number of rows, flowing from the Columnstore Index Scan to the Hash Match operator – I have noticed a different number of rows then I have used to see: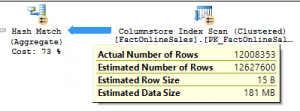
The actual number of rows in the plan were 12008353!
The real number of rows that are stored inside the dbo.FactOnlineSales table are 12627608 and not that number! There are a little bit over 600.000 rows missing!
To test it, I immediately executed the row counting query:
select count(*)
from dbo.FactOnlineSales;
Everything was right. The result was 12627608 rows.
I have had not even one elimination predicate, I did not use the WHERE clause – is there a mistake in the execution plan?
Pointing to the Columnstore Index Scan was a huge revelation for me: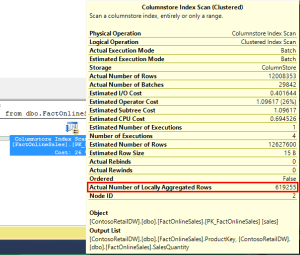
There is a new line in the properties of the iterator, showing the number of locally aggregated rows and that number equals 619255, that should be exactly the number of rows that is missing from the arrow connecting 2 iterators:
select 12008353 + 619255
Gives us our perfect 12627608 rows.
Eureca!
Is there any more information on this operation?
Indeed, just right-click on the Columnstore Index Scan and select it’s properties: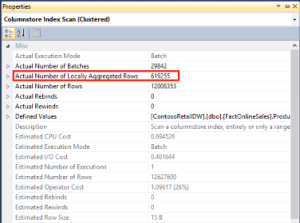
There we can see “Actual Number of Locally Aggregated Rows” showing us the needed numbers, which can actually be expanded to see the statistics per used Thread.
I have decided to take a look at the XML of the actual execution plan, in order to see how this information is being presented there:
With the latest addition of the detailed properties, such as actual execution time and actual elapsed time, plus the IO properties, we have information on the locally aggregated rows as well. There is a lot of potential with this new information and I am really looking forward to see the upcoming releases of SQL Server.
But what is the local aggregation ? Is it happening in all predicate pushdown operations?
Let’s get back to the original query with a max(SalesQuantity) operation to see how it is being displayed there:
select max(SalesQuantity)
    from dbo.FactOnlineSales;
Looking at the properties of the Columnstore Index Scan, we see that all rows were locally aggregated: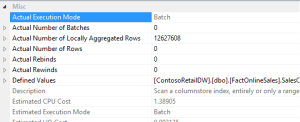
Here we see that the local aggregation was executed against all rows, which makes sense – since the predicate pushdown is a kind of a local aggregation. From all my tests the local aggregation takes place if we are scanning whole table or using a Group By.
Well, well – let me see: could Segment Clustering actually help this operation ? Like ordering the data in order to improve the aggregation performance.
Let’s try it out on the ProductKey column, for that purpose using the good old technique – creating a clustered rowstore index on the column, then creating a columnstore index over it, all with the help of just 1 thread:
create clustered Index PK_FactOnlineSales
on dbo.FactOnlineSales (ProductKey)
with (drop_existing = on, maxdop = 1);

create clustered columnstore Index PK_FactOnlineSales
on dbo.FactOnlineSales
with (drop_existing = on, maxdop = 1);
Let’s verify the status of the column alignment, with the help of the free CISL library:
exec dbo.cstore_GetAlignment @tableName = 'FactOnlineSales', @columnName = 'ProductKey';
Now that the ProductKey is fully aligned, let’s execute the test query again:
select sales.ProductKey,
sum(sales.SalesQuantity)
from dbo.FactOnlineSales sales
group by sales.ProductKey;
This time we have over 2 million of aggregated rows, which should translate into the query performance, so went to compare the performance, and the results that I have received after 10 executions of each of the scenarios are quite clear:
406 ms for the CPU time and 221 ms for the elapsed time for the non-aligned scenario;
219 ms for the CPU time and 177 ms for the elapsed time for the aligned scenario.
If the numbers are not enough, then take a look at the difference I have noticed: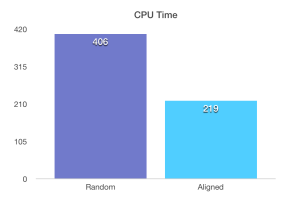
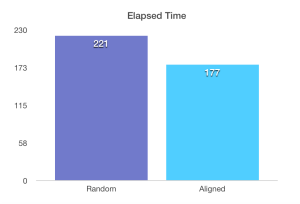
Very nice improvement from the previous version, this one must have been be a couple months in the CTP’s, I rapidly checked that it already was in CTP 3.3.
to be continued with Columnstore Indexes – part 81 (“Adding Columnstore Index to InMemory Tables”)


