SQL Server engine does an excellent job to optimize query performance and it has different methods to achieve this goal, one of these methods is the data caching.
Data caching consist of putting 8KB pages from storage into memory as they are needed, so the database engine can access the required data again in a much faster way.
At a glance, the way SQL Engine caches the data is the following:
When a request is made the engine checks if the data is already cached in memory (or buffer pool), if the data is already available, then it is returned. If the data is not available, then it is retrieved from storage and put into memory until the buffer pool is full.
How long the data is stored in the buffer pool depends on various aspects: the memory allocated to SQL Server, size of your database, workload, type of queries executed, In-memory OLTP.. etc.
When the buffer pool does not have enough space to allocate the desired memory, then a data spill occurs, it consists of additional data stored on tempdb, this is usually caused by inaccurate memory grants. Fortunately, in SQL Server 2019 Memory Grant feedback is being implemented, that can help to reduce this problem, you can read more about it here.
Since SQL Server 2014, you can also configure Buffer pool extensions, as the term suggests, this consist on an extension of the memory by using faster storage (usually SSD or Flash memory), this is an advanced feature and you can learn more about it in the Microsoft documentation.
Related T-SQL Commands
You have now a concept on what is the data caching and how it works, now let us see it in action.
we will use WideWorldImporters test database for this example, first we run some queries, does not matter what you execute for this example, can be any SELECT statement:
DECLARE  @RawValue decimal(10,2) = 25000

SELECT SUM(UnitPrice * Quantity) as RawValue
FROM Sales.InvoiceLines
GROUP BY InvoiceID
HAVING SUM(UnitPrice * Quantity) > @RawValue;

SET @RawValue = RAND()*1500

SELECT InvoiceID, InvoiceLineID, UnitPrice,Quantity
FROM Sales.InvoiceLines
WHERE TaxAmount > @RawValue
OPTION(FAST 100);
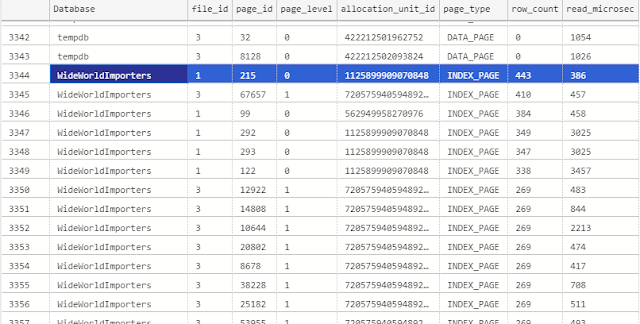
After that we use the DMO sys.dm_os_buffer_descriptors to check what data is into memory, after making the query more readable we can use it like this:
--DETAILS BY DATABASE:
SELECT
    IIF(database_id = 32767,'ResourceDB',DB_NAME(database_id)) AS [Database],
    file_id, -- This File is at database level, it depends on the database you are executing the query
    page_id,
    page_level,
    allocation_unit_id, -- can be joined with sys.allocation_units (database level DMO)
    page_type,
row_count,
    read_microsec
FROM sys.dm_os_buffer_descriptors BD
ORDER BY [Database], row_count DESC;
Depending on the workload, we obtain something like this:
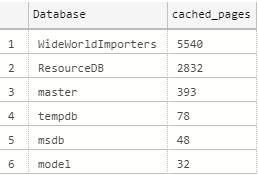
If you want something more compact, you can execute the query grouping it by database:
-- TO OBTAIN TOTAL BY DATABASE:
SELECT
    IIF(database_id = 32767,'ResourceDB',DB_NAME(database_id)) AS [Database],
COUNT(row_count) AS cached_pages
FROM sys.dm_os_buffer_descriptors
GROUP BY database_id
ORDER BY cached_pages DESC;
We obtain the results grouped by database:
In order to release the data from the cache, you run the DBCC DROPCLEANBUFFERS command:
DBCC DROPCLEANBUFFERS;
NOTE: Avoid running this command in production environments, since all the data will be released from memory and must be pulled from the storage again, incurring in additional IO usage.
If you have Buffer pool extension enabled and want to check their options, or if you want to determine if the instance has it, use the sys.dm_os_buffer_pool_extension_configuration DMO as follows:
-- Check if you have a buffer pool extension enabled:
SELECT * FROM sys.dm_os_buffer_pool_extension_configuration;
The results are something like this (I don't have a buffer pool extension enabled on my machine):
If you want the script for the commands we discussed, you can download it from my GitHub repository.


