This is blog post #2 in support of Tim Ford’s (b|t) #iwanttohelp, #entrylevel.
If you haven’t been working in SQL Server for very long, you may not have got this phone call yet, but you will:
Hi, yeah, the server is slow. Thanks. Bye.
Let’s pretend for a moment that you know which server they’re referring to (because just finding out that piece of information can be a challenge). Now what?
The list of tools and mechanisms within SQL Server for gathering metrics is extremely long:
Performance Monitor
Dynamic Management Views & Functions
System Views
Extended Events
Trace Events
Activity Monitor
Data Collector
Execution Plans
3rd Party Tools
I’m leaving out lots of stuff in that list. So where do you start when you get this phone call? Where is the server slow?
The best place to start is by looking at the wait statistics.
A simple, and simplified, explanation for how processes work within SQL Server is that each process gets access to the various resources for a little while, then has to pass off access to another process, each of them working together to get the work done. But, some processes take longer than others. When a process has to wait for anything in SQL Server, this information gets logged. Depending on the system you’re working with you can access these wait statistics from one of three locations:
sys.dm_os_wait_stats: for SQL Server
sys.dm_db_wait_stats: for Azure SQL Database
sys.dm_pdw_nodes_os_wait_stats: for Azurew SQL Data Warehouse
Getting information from these system views is extremely simple. Here’s an example query:
SELECT  *
FROM    sys.dm_os_wait_stats AS dows
ORDER BY dows.wait_time_ms DESC;
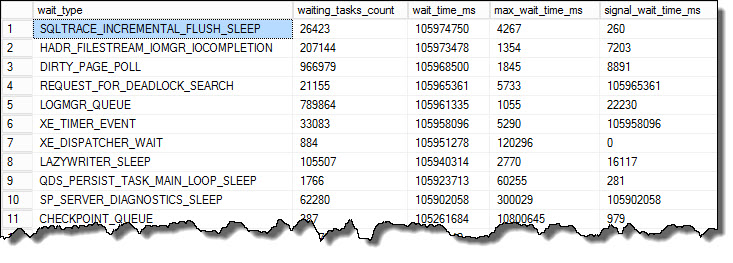
The results of this query look like this:

The first column lists the wait types. The second column provides a count of the tasks that have had that wait type. The third column, wait_time_ms, is the amount of time in milliseconds that tasks have been waiting within the system, cumulative. Next is the maximum wait time that any one task has waited, max_wait_time_ms. Finally, signal_wait_time_ms, you see the time that the waits have had to wait for access to the CPU (also known as time spent on the Runnable queue). The importance of waits are not simply the time that a wait has had, but also the number of tasks and the max time. Using all these values gives meaning to the individual wait.
Here is where things actually get difficult. The wait types are arcane, difficult to understand, and difficult to interpret. Further, a lot of the wait types actually don’t mean anything at all. The waits are not indicative of an issue. So, while the query above is simple, the results it provides are very weak. Instead, I strongly recommend you use the query provided by Paul Randal, located here. It will filter out the wait statistics that you shouldn’t care about.
Now, you have a meaningful list of wait statistics that will tell you exactly why, if not where, your server is running slow. Unfortunately, these waits still need to be interpreted. If you read further on Paul’s blog, you’ll see he has a number of waits and their causes documented. That’s your best bet to start understanding what’s happening on your system (although, I hear, Paul might be creating a more complete database of wait stats. I’ll update this blog post should that become available).
One other thing to consider. These waits are since the last time the server was started (or failed over, or the database was failed over in Azure, or if the values have been reset). This means that simply looking at the list doesn’t give you necessarily enough information. Instead, running this more than once during a day can show you what’s been slow over time by comparing the two data sets. You can also use sys.dm_exec_session_wait_stats to see what any given session is experiencing if you want to know what a given user or process is experiencing. Don’t just look at the list and think you’re done. The best thing to do is get to a point of proactive monitoring (for this, monitoring tools make it easier).
So, when you get the phone call that says the server is slow, you know how to get started understanding exactly why that may be the truth.
The post Why Is The Server Slow? appeared first on Home Of The Scary DBA.


