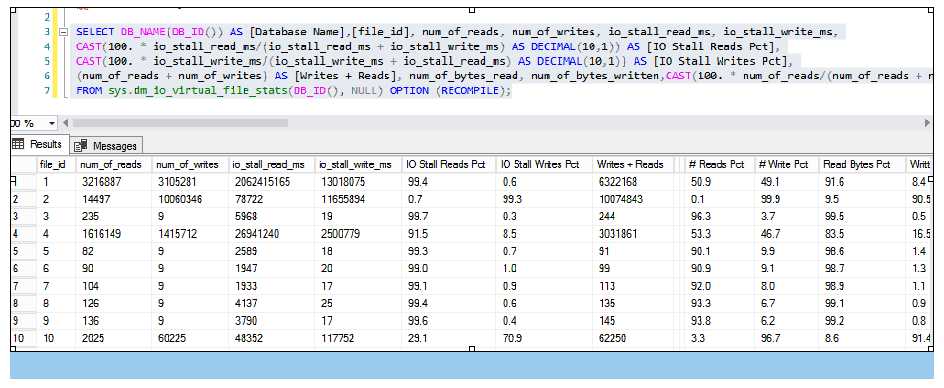
I/O Statistics by file per database?
-
November 2, 2020 at 9:18 pm
Do you look at something like that or any alert set on this info anywhere in your environment?
What can such info be most useful for in troubleshooting cases?
-- I/O Statistics by file for the (current) database
SELECT DB_NAME(DB_ID()) AS [Database Name],[file_id], num_of_reads, num_of_writes,
io_stall_read_ms, io_stall_write_ms,
CAST(100. * io_stall_read_ms/(io_stall_read_ms + io_stall_write_ms) AS DECIMAL(10,1)) AS [IO Stall Reads Pct],
CAST(100. * io_stall_write_ms/(io_stall_write_ms + io_stall_read_ms) AS DECIMAL(10,1)) AS [IO Stall Writes Pct],
(num_of_reads + num_of_writes) AS [Writes + Reads], num_of_bytes_read, num_of_bytes_written,
CAST(100. * num_of_reads/(num_of_reads + num_of_writes) AS DECIMAL(10,1)) AS [# Reads Pct],
CAST(100. * num_of_writes/(num_of_reads + num_of_writes) AS DECIMAL(10,1)) AS [# Write Pct],
CAST(100. * num_of_bytes_read/(num_of_bytes_read + num_of_bytes_written) AS DECIMAL(10,1)) AS [Read Bytes Pct],
CAST(100. * num_of_bytes_written/(num_of_bytes_read + num_of_bytes_written) AS DECIMAL(10,1)) AS [Written Bytes Pct]
FROM sys.dm_io_virtual_file_stats(DB_ID(), NULL) OPTION (RECOMPILE);
-- sample resultset attached
Likes to play Chess
-
November 2, 2020 at 9:20 pm
-
November 3, 2020 at 4:47 pm
No, I do not have an alert on this. I do watch these things.
In order for any of these to be an alertable metric, you would need to capture a baseline over time. A single run of this would only indicate which databases at a given time are using the IO resources. For example, if the number of writes averaged X over the last month, and today it exceeded that by Y percent, then that may be something to look at.
Michael L John
If you assassinate a DBA, would you pull a trigger?
To properly post on a forum:
http://www.sqlservercentral.com/articles/61537/ -
November 3, 2020 at 6:23 pm
My question would be... What do you expect to actually do with such information? It qualifies which files are the busiest but not why or whether or not being so busy or not busy is right. You're measuring a symptom instead of a cause.
That's also a primary gripe I have with a lot of so-called monitoring tools.
--Jeff Moden
RBAR is pronounced "ree-bar" and is a "Modenism" for Row-By-Agonizing-Row.
First step towards the paradigm shift of writing Set Based code:
________Stop thinking about what you want to do to a ROW... think, instead, of what you want to do to a COLUMN.Change is inevitable... Change for the better is not.
Helpful Links:
How to post code problems
How to Post Performance Problems
Create a Tally Function (fnTally) -
November 3, 2020 at 6:58 pm
I only used it in combination with the below.
File i/o + which tables on those files and + whether top i/o reads/writes SPs
Work with those tables + What individual SQL Statements within those SPs consume
The most i/o + whether the physical io_writes/reads also high for those ( = suspicious…).
-- Lists the top statements by average input/output usage for the current database:
SELECT TOP(50) OBJECT_NAME(qt.objectid) AS [SP Name],
(qs.total_logical_reads + qs.total_logical_writes) /qs.execution_count AS [Avg IO],
SUBSTRING(qt.[text],qs.statement_start_offset/2,
(CASE
WHEN qs.statement_end_offset = -1
THEN LEN(CONVERT(nvarchar(max), qt.[text])) * 2
ELSE qs.statement_end_offset
END - qs.statement_start_offset)/2) AS [Query Text]
FROM sys.dm_exec_query_stats AS qs WITH (NOLOCK)
CROSS APPLY sys.dm_exec_sql_text(qs.sql_handle) AS qt
WHERE qt.[dbid] = DB_ID()
ORDER BY [Avg IO] DESC OPTION (RECOMPILE);
-- Helps to find the most expensive statements for I/O by SP (!)
Likes to play Chess
-
November 3, 2020 at 9:14 pm
Why not just use sp_WhoIsActive for that stuff? It's free.
Like I said before, knowing which files are the most active won't tell you a thing about what your problems are or if there are any problems.
--Jeff Moden
RBAR is pronounced "ree-bar" and is a "Modenism" for Row-By-Agonizing-Row.
First step towards the paradigm shift of writing Set Based code:
________Stop thinking about what you want to do to a ROW... think, instead, of what you want to do to a COLUMN.Change is inevitable... Change for the better is not.
Helpful Links:
How to post code problems
How to Post Performance Problems
Create a Tally Function (fnTally)
Viewing 6 posts - 1 through 6 (of 6 total)
You must be logged in to reply to this topic. Login to reply
