I have been working with SQL server for more years than I really care to mention and like to think that I am now quite comfortable with the internals, specifically the Query Optimizer. Every so often though a new problem gets thrown into the mix, just to keep me on my toes ( or so it would seem ? ).
Plans go “wrong” for a multitude of reasons, but they mostly boil down to a poor estimation. Poor estimations are generally caused by inadequate statistics. This is why SQL Server puts so much effort into efficiently creating and maintaining them. So, on my dev box I had a plan that went “wrong”, a 3 sec process turned into a 3hr process, a quick bit of investigation quickly turned up the culprit. A relatively simple select statement, no worries, its probably due to an old cached plan being used. Here is the plan:
In reality, Application had hundreds of thousands of rows not one.
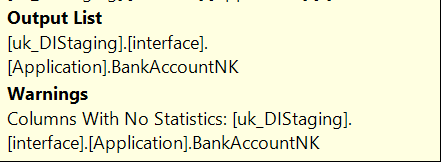
So, I added WITH(RECOMPILE), that should sort that one. But NO, on the next run, same thing with the same statement. Curious! Running the statement in isolation caused a “good” plan to be built, running with the full process, a “Bad” plan was built. So, why a bad estimation ? Bad stats ? In fact the plan was stating “missing stats” as a warning.
Right, so not Bad stats, it’s no stats. Why would there be no stats ? Not too many reasons, async stats processing could be a culprit, it’s a large table so stats could be potentially built async. But, no, that option is disabled.
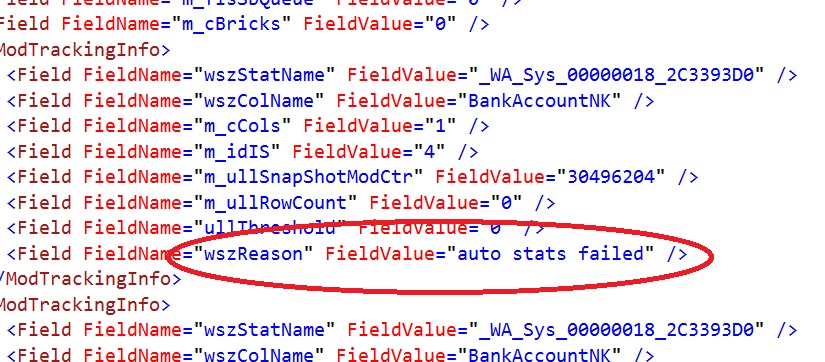
Possibilities are narrowing down now, but I thought that I would take a look at the internal info that is not normally available within the execution plan. For this you will need to use the undocumented trace flag 8666: Turn this on using DBCC TRACEON(8666) before retrieving the plan.
So inside the plan, I saw this :
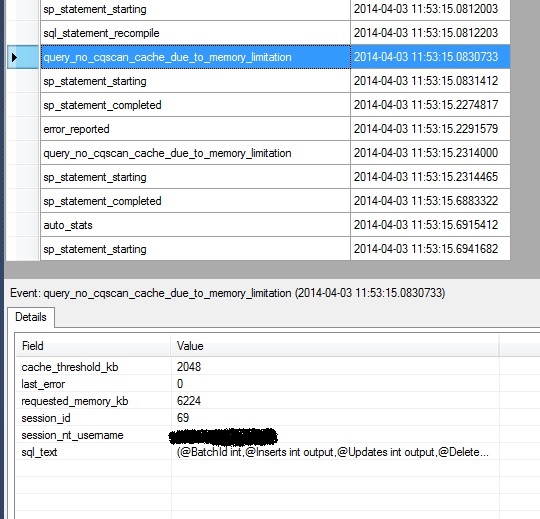
Stats failed to build, not “not found” or “non existent” the stats actually failed to build. Running profiler with error events, StmtStarting and StmtEnding we can see this activity happening. If you are not aware, stats are built using the STATMAN function, this can be seen using a profiler trace just as any user initiated action can. So, run the process and….
There it failed to build stats, so the estimation was wrong and I got a bad plan, bingo. That’s the effect, whats the cause of the failed stats build ?
There are a few reasons why stats fail to build mostly edge-case scenarios such as deadlock, but remember that I said this was a dev box ? A small dev box indeed, in this case the stats build failed due to memory pressure. How can I be certain of that ? Well playing the hunch card I saw an extended event, “query_no_cqscan_due_to_memory_limitation”, this, in amongst a few others sounded relevant and indeed when running the process through that event does fire when statements fail to build with memory pressure.
Sometimes I am in awe of the amount of work that has gone into SQLServers’ query processing engine and this is one of those. Ideally I would have liked the problem to be signposted more clearly, maybe the error log, but beggars can’t be choosers.


