Accurate Estimations, But Hash Match Aggregate Spilling to TempDB
-
June 29, 2018 at 10:10 am
Hi,
I'm on SQL Server 2016 Enterprise, V13.0.5026.0. I have a straightforward query that runs on a fact table with a clustered columnstore index on it. The query groups on 1 column and sums 56 columns. The query plan is very straightforward:
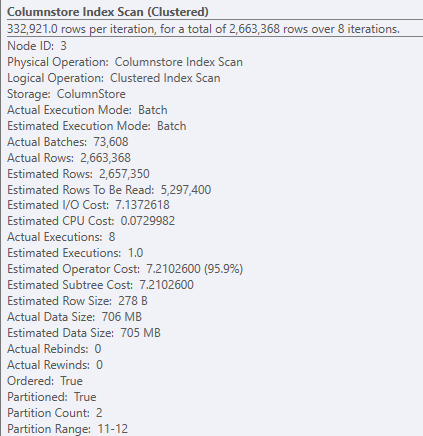
The columnstore index scan is running in batch mode, and the estimated row counts are very close to the actual row counts:

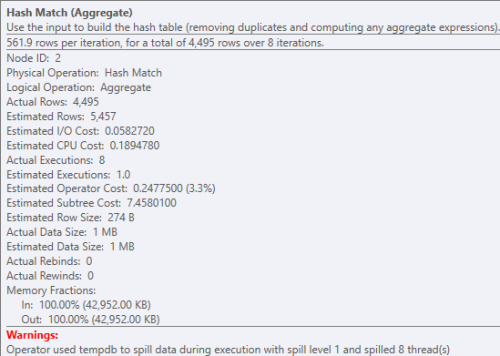
As shown above, the row count estimates are pretty good, but slightly under the actual count by 6K (similarly, the estimated data size is under the actual by 1MB). The problem is that the hash match (aggregate) operation spills to tempDB, slowing this query down:

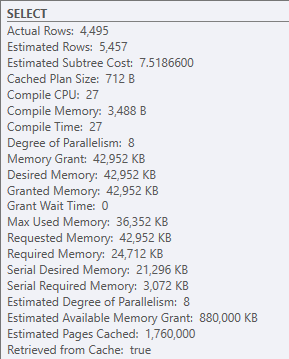
When I look at the overall memory usage, it shows that 42,952KB was requested and granted, but the max used was only 36,352KB:

So why is this spilling to tempdb? Is it because the estimated row count is 6K off? Statistics are up to date, and the columnstore index has been built fresh. I've tested with option(min_grant_percent = XX) to artificially increase the mem grant, and that gets rid of the temp db spill and reduces the query time by 50%. Without using the mem_grant hint, what can I do to get rid of the spill?
-
July 9, 2018 at 10:43 am
Without a much closer look at your environment, all I can do is make wild guesses. First question that this post makes me ask is whether your existing environment is RAM constrained. Also, how often do you tune queries for performance, and have you been effective when doing so? Does the execution plan change when you provide the memory grant hint? You can be RAM constrained, and severely, and still have it not be blatantly obvious, as SQL Server has many tools at it's disposal for shifting things around. I'd start looking at memory usage over time as well as any kind of wait statistics you can get your hands on, where RAM is concerned.
Steve (aka sgmunson) 🙂 🙂 🙂
Rent Servers for Income (picks and shovels strategy) -
July 9, 2018 at 11:26 am
chris.o.smith - Friday, June 29, 2018 10:10 AMHi,
I'm on SQL Server 2016 Enterprise, V13.0.5026.0. I have a straightforward query that runs on a fact table with a clustered columnstore index on it. The query groups on 1 column and sums 56 columns. The query plan is very straightforward:
The columnstore index scan is running in batch mode, and the estimated row counts are very close to the actual row counts:

As shown above, the row count estimates are pretty good, but slightly under the actual count by 6K (similarly, the estimated data size is under the actual by 1MB). The problem is that the hash match (aggregate) operation spills to tempDB, slowing this query down:

When I look at the overall memory usage, it shows that 42,952KB was requested and granted, but the max used was only 36,352KB:

So why is this spilling to tempdb? Is it because the estimated row count is 6K off? Statistics are up to date, and the columnstore index has been built fresh. I've tested with option(min_grant_percent = XX) to artificially increase the mem grant, and that gets rid of the temp db spill and reduces the query time by 50%. Without using the mem_grant hint, what can I do to get rid of the spill?
Judging by the execution plan, the Hash Match isn't your problem. A clustered index scan of over 2 million rows is your real problem.
--Jeff Moden
RBAR is pronounced "ree-bar" and is a "Modenism" for Row-By-Agonizing-Row.
First step towards the paradigm shift of writing Set Based code:
________Stop thinking about what you want to do to a ROW... think, instead, of what you want to do to a COLUMN.Change is inevitable... Change for the better is not.
Helpful Links:
How to post code problems
How to Post Performance Problems
Create a Tally Function (fnTally) -
July 9, 2018 at 12:19 pm
Jeff Moden - Monday, July 9, 2018 11:26 AMchris.o.smith - Friday, June 29, 2018 10:10 AMHi,
I'm on SQL Server 2016 Enterprise, V13.0.5026.0. I have a straightforward query that runs on a fact table with a clustered columnstore index on it. The query groups on 1 column and sums 56 columns. The query plan is very straightforward:
The columnstore index scan is running in batch mode, and the estimated row counts are very close to the actual row counts:

As shown above, the row count estimates are pretty good, but slightly under the actual count by 6K (similarly, the estimated data size is under the actual by 1MB). The problem is that the hash match (aggregate) operation spills to tempDB, slowing this query down:

When I look at the overall memory usage, it shows that 42,952KB was requested and granted, but the max used was only 36,352KB:

So why is this spilling to tempdb? Is it because the estimated row count is 6K off? Statistics are up to date, and the columnstore index has been built fresh. I've tested with option(min_grant_percent = XX) to artificially increase the mem grant, and that gets rid of the temp db spill and reduces the query time by 50%. Without using the mem_grant hint, what can I do to get rid of the spill?
Judging by the execution plan, the Hash Match isn't your problem. A clustered index scan of over 2 million rows is your real problem.
It's a columnstore index. Two partitions are scanned, so you're going to have a minimum of 2M rows scanned.
Two millions rows for a columnstore shouldn't be that big a deal. Would need to see the partition definitions and the actual query to provide more info.
SQL DBA,SQL Server MVP(07, 08, 09) "It's a dog-eat-dog world, and I'm wearing Milk-Bone underwear." "Norm", on "Cheers". Also from "Cheers", from "Carla": "You need to know 3 things about Tortelli men: Tortelli men draw women like flies; Tortelli men treat women like flies; Tortelli men's brains are in their flies".
-
July 16, 2018 at 7:23 am
Thanks for the responses, and sorry for the delay - the responses came in right as I left for vacation. As Scott mentioned, this is a clustered columnstore index, so the 2M scan shouldn't be an issue. It does a good job of partition elimination and starts the query off with only scanning 2 partitions. To answer some of the original questions:
- The environment is not RAM constrained. We've got 512GB of memory on this dev machine, and I'm testing the query in isolation (nothing else is running at the time the query is run)
- We tune queries for performance in order to use the columnstore index as efficiently as possible. This typically involves tweaking our complex queries so that they run in batch mode. We typically do not add hints to tweak our reporting queries though.
- No, the execution plan does not change when you provide the memory grant hint. The only difference is that more memory is given to the query, and there is no tempDB spill.If I remove some of the columns that are being summed (there are 56 in total for the full query), then the tempDB spill goes away and performance is great again. It looks like SQL Server estimates the required memory poorly once I hit a certain number of columns being summed, which is a bummer. As I mentioned in my original post, the query is very straight-forward. It essentially looks like this:
SELECT groupCol, sum(col1), sum(col2), ..., sum(col56)
where daterange between date1 and date2
group by groupCol -
July 16, 2018 at 7:53 am
chris.o.smith - Monday, July 16, 2018 7:23 AMThanks for the responses, and sorry for the delay - the responses came in right as I left for vacation. As Scott mentioned, this is a clustered columnstore index, so the 2M scan shouldn't be an issue. It does a good job of partition elimination and starts the query off with only scanning 2 partitions. To answer some of the original questions:
- The environment is not RAM constrained. We've got 512GB of memory on this dev machine, and I'm testing the query in isolation (nothing else is running at the time the query is run)
- We tune queries for performance in order to use the columnstore index as efficiently as possible. This typically involves tweaking our complex queries so that they run in batch mode. We typically do not add hints to tweak our reporting queries though.
- No, the execution plan does not change when you provide the memory grant hint. The only difference is that more memory is given to the query, and there is no tempDB spill.If I remove some of the columns that are being summed (there are 56 in total for the full query), then the tempDB spill goes away and performance is great again. It looks like SQL Server estimates the required memory poorly once I hit a certain number of columns being summed, which is a bummer. As I mentioned in my original post, the query is very straight-forward. It essentially looks like this:
SELECT groupCol, sum(col1), sum(col2), ..., sum(col56)
where daterange between date1 and date2
group by groupCol
Just curious as to the size of a row with the grouping column together with 56 sums. From what you are seeing, it appears very much as if you've just kind of run up against a bit of a hard limit, so to speak, but perhaps more of a "soft one" because just providing the additional RAM resource solves it, and reducing the number of sums also solves it.
Steve (aka sgmunson) 🙂 🙂 🙂
Rent Servers for Income (picks and shovels strategy) -
July 16, 2018 at 8:10 am
sgmunson - Monday, July 16, 2018 7:53 AMchris.o.smith - Monday, July 16, 2018 7:23 AMThanks for the responses, and sorry for the delay - the responses came in right as I left for vacation. As Scott mentioned, this is a clustered columnstore index, so the 2M scan shouldn't be an issue. It does a good job of partition elimination and starts the query off with only scanning 2 partitions. To answer some of the original questions:
- The environment is not RAM constrained. We've got 512GB of memory on this dev machine, and I'm testing the query in isolation (nothing else is running at the time the query is run)
- We tune queries for performance in order to use the columnstore index as efficiently as possible. This typically involves tweaking our complex queries so that they run in batch mode. We typically do not add hints to tweak our reporting queries though.
- No, the execution plan does not change when you provide the memory grant hint. The only difference is that more memory is given to the query, and there is no tempDB spill.If I remove some of the columns that are being summed (there are 56 in total for the full query), then the tempDB spill goes away and performance is great again. It looks like SQL Server estimates the required memory poorly once I hit a certain number of columns being summed, which is a bummer. As I mentioned in my original post, the query is very straight-forward. It essentially looks like this:
SELECT groupCol, sum(col1), sum(col2), ..., sum(col56)
where daterange between date1 and date2
group by groupCol
Just curious as to the size of a row with the grouping column together with 56 sums. From what you are seeing, it appears very much as if you've just kind of run up against a bit of a hard limit, so to speak, but perhaps more of a "soft one" because just providing the additional RAM resource solves it, and reducing the number of sums also solves it.
The size of a row would be: 8 FLOAT columns @ 8 bytes each + 49 INT columns @ 4 bytes each = 260 bytes per row
-
July 17, 2018 at 8:18 am
chris.o.smith - Monday, July 16, 2018 7:23 AMThanks for the responses, and sorry for the delay - the responses came in right as I left for vacation. As Scott mentioned, this is a clustered columnstore index, so the 2M scan shouldn't be an issue. It does a good job of partition elimination and starts the query off with only scanning 2 partitions. To answer some of the original questions:
- The environment is not RAM constrained. We've got 512GB of memory on this dev machine, and I'm testing the query in isolation (nothing else is running at the time the query is run)
- We tune queries for performance in order to use the columnstore index as efficiently as possible. This typically involves tweaking our complex queries so that they run in batch mode. We typically do not add hints to tweak our reporting queries though.
- No, the execution plan does not change when you provide the memory grant hint. The only difference is that more memory is given to the query, and there is no tempDB spill.If I remove some of the columns that are being summed (there are 56 in total for the full query), then the tempDB spill goes away and performance is great again. It looks like SQL Server estimates the required memory poorly once I hit a certain number of columns being summed, which is a bummer. As I mentioned in my original post, the query is very straight-forward. It essentially looks like this:
SELECT groupCol, sum(col1), sum(col2), ..., sum(col56)
where daterange between date1 and date2
group by groupCol
Is the table partitioned on daterange? The idea is to avoid a heavy sort if possible. Reading 2M rows is not a big deal, sorting 2M rows could be.
If you (almost) always specify a date range in the WHERE clause, you might be better off using a row-based table clustered on the daterange column. The disadvantage of a columnstore is that if it can't push the aggregate down, and has to do a sort for it, it can be more overhead than you expect.
SQL DBA,SQL Server MVP(07, 08, 09) "It's a dog-eat-dog world, and I'm wearing Milk-Bone underwear." "Norm", on "Cheers". Also from "Cheers", from "Carla": "You need to know 3 things about Tortelli men: Tortelli men draw women like flies; Tortelli men treat women like flies; Tortelli men's brains are in their flies".
-
July 17, 2018 at 10:51 am
ScottPletcher - Tuesday, July 17, 2018 8:18 AMchris.o.smith - Monday, July 16, 2018 7:23 AMThanks for the responses, and sorry for the delay - the responses came in right as I left for vacation. As Scott mentioned, this is a clustered columnstore index, so the 2M scan shouldn't be an issue. It does a good job of partition elimination and starts the query off with only scanning 2 partitions. To answer some of the original questions:
- The environment is not RAM constrained. We've got 512GB of memory on this dev machine, and I'm testing the query in isolation (nothing else is running at the time the query is run)
- We tune queries for performance in order to use the columnstore index as efficiently as possible. This typically involves tweaking our complex queries so that they run in batch mode. We typically do not add hints to tweak our reporting queries though.
- No, the execution plan does not change when you provide the memory grant hint. The only difference is that more memory is given to the query, and there is no tempDB spill.If I remove some of the columns that are being summed (there are 56 in total for the full query), then the tempDB spill goes away and performance is great again. It looks like SQL Server estimates the required memory poorly once I hit a certain number of columns being summed, which is a bummer. As I mentioned in my original post, the query is very straight-forward. It essentially looks like this:
SELECT groupCol, sum(col1), sum(col2), ..., sum(col56)
where daterange between date1 and date2
group by groupCol
Is the table partitioned on daterange? The idea is to avoid a heavy sort if possible. Reading 2M rows is not a big deal, sorting 2M rows could be.
If you (almost) always specify a date range in the WHERE clause, you might be better off using a row-based table clustered on the daterange column. The disadvantage of a columnstore is that if it can't push the aggregate down, and has to do a sort for it, it can be more overhead than you expect.
Yes, the table is partitioned on daterange. There is no sort in the query plan (see earlier post which shows the graphical representation of the plan); the only problem that I'm encountering is that SQL Server isn't supplying enough memory for the query, so we get the tempdb spill. If I increase memory using the min_grant_percent hint, then the spill goes away and I see a 50% performance improvement. Usually, when I see this type of spill it means that the estimated row count is way off. In this case, it's very accurate. And the query is very straightforward and the system has plenty of memory, so I'm confused as to why the tempdb spill exists in the first place.
Viewing 9 posts - 1 through 9 (of 9 total)
You must be logged in to reply to this topic. Login to reply


