Adding Sum to Variables
-
Hello, I'm not sure if I'm even phrasing this correctly, so please excuse lame or novice comments 🙂
Infor: GL Account numbers have a location identifier. For example position 11-13 denotes the office location.
For 5 series GL Accounts I have a matrix. Header Column is the GL Account Number (and description which I don't need). Data Columns are summed by month, which again I don't need. And Sum of each line, by GL Account. Second Matrix for 6 accounts as above.
My goal is, in this second matrix to look at this line's GL office location and compare it to the matching 5 Series GL Total and show a percent.
Clear as mud?
Thank you for any help you can give.
-
October 29, 2019 at 9:28 pm
You have 2 types of GL Accounts: 5 series, and 6 series. For each type you have a matrix which defines the offset positions of data columns which include: location, account number, account description, monthly total (of what?), yearly total (of what?). You'd like to compare grand total sums by location across 5 and 6 series account types?
Aus dem Paradies, das Cantor uns geschaffen, soll uns niemand vertreiben können
-
October 29, 2019 at 10:35 pm
Ken at work wrote:Hello, I'm not sure if I'm even phrasing this correctly, so please excuse lame or novice comments 🙂
Infor: GL Account numbers have a location identifier. For example position 11-13 denotes the office location.
For 5 series GL Accounts I have a matrix. Header Column is the GL Account Number (and description which I don't need). Data Columns are summed by month, which again I don't need. And Sum of each line, by GL Account. Second Matrix for 6 accounts as above.
My goal is, in this second matrix to look at this line's GL office location and compare it to the matching 5 Series GL Total and show a percent.
Clear as mud?
Thank you for any help you can give.
Can you show us some sample data. And what, exactly, do you want help with?
-
October 30, 2019 at 2:02 pm
I posted and now I don't see it???
-
October 30, 2019 at 2:20 pm
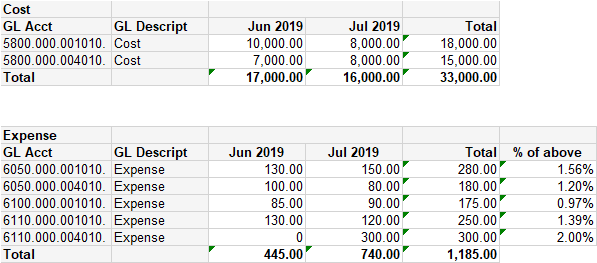
Here is an example. The last six digits of the GL Account number represent Region/Division. The first matrix totals the 5 series GL Accounts. The second matrix actually has a lot more rows. But, the last column '% from above' should compare the Region/Division and calculate the percent.

I can, of course, add separate and rather easy queries for each Region/Division and use that number. But this it would be dynamic.
Thank you for your help.
-
October 30, 2019 at 3:25 pm
With > 3,000 points, I assumed that you'd know that a request for sample data does not mean 'please provide a screenshot of a spreadsheet'. That's assuming you are asking for help in composing a T-SQL query (you have stated a requirement and asked for help ... but you still have not specified exactly what it is that you require help with).
Please provide sample data in the form of DDL CREATE TABLE and DML INSERT statements.
For the sample data provided, please provide the output which you would like to see (this can be a screenshot).
-
October 30, 2019 at 3:30 pm
You've been around long enough to know that you should post sample data (as DML with
INSERTs) and not pictures. I can't cut and paste your pictures into SSMS.You need to use a windowed aggregate (either
SUM()orMAX()depending on your data) partitioned by the division with aCASEexpression on the series to find the total for the 5 series and use that to calculate the percentage for the 6 series. If you want actual code, provide actual sample data.Drew
J. Drew Allen
Business Intelligence Analyst
Philadelphia, PA -
October 30, 2019 at 3:31 pm
Thanks but I can do the T-SQL. I'll just do that.
-
If you want to be able to calculate or pull information from one Matrix to another (or rather - from a different dataset) - then you can use a LOOKUP to get that information from the other dataset. If the value needs to be aggregated - then you can specify the data region in a SUM to pull the specific data.
To make things easier - I would recommend including a column in both datasets that has already parsed out the account location identifier. This way you can easily perform the lookup or sum based on the location identifier instead of trying to parse that value and perform a lookup.
Jeffrey Williams
“We are all faced with a series of great opportunities brilliantly disguised as impossible situations.”― Charles R. Swindoll
How to post questions to get better answers faster
Managing Transaction Logs
Viewing 9 posts - 1 through 9 (of 9 total)
You must be logged in to reply to this topic. Login to reply
